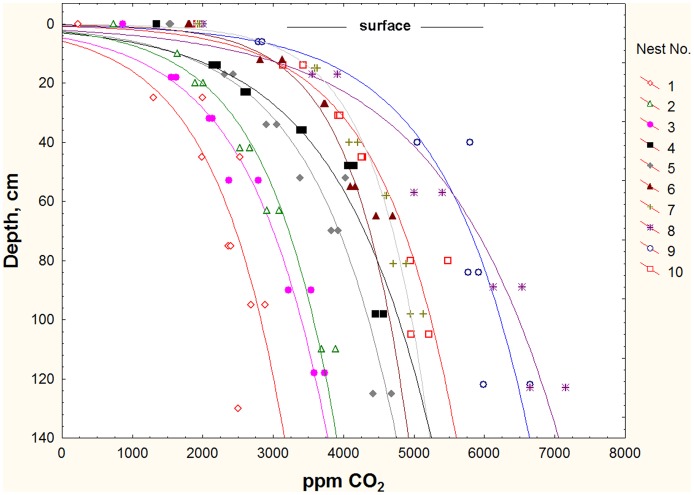
Figure 4. Carbon dioxide concentration in harvester ant nests in relation to depth below the ground surface.
Each curve represents a different nest, some of which were active and some abandoned (ghosts). Whereas nests differed significantly, ghosts and active nests did not. The CO2 concentration was a linear function of the logarithm of the depth.

