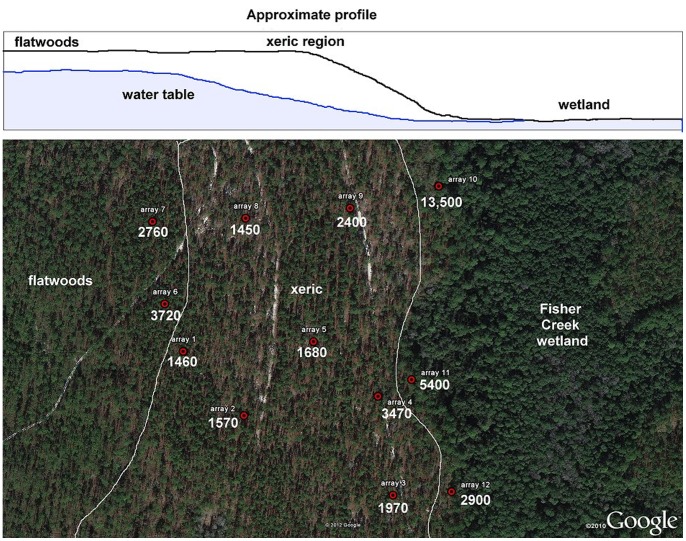
Figure 10. The Ant Heaven site showing the location of CO2 sampling arrays, the flatwoods margin and the Fisher Creek wetland.
Numbers associated with each array are the slopes of the regression of ppm CO2 against the log of the depth, and can be interpreted as the increase in ppm CO2 for each ten-fold increase in depth. Maximum sampled depth was 175 cm, but the deepest sampling vials in arrays 10 and 11 were sometimes below the water table, i.e. flooded. The presence of the low-lying wetland depresses the water table under the central part of the site. Water table depth was usually <2 m at both the wetland and flatwoods margins, but >5 m in the transitional zone.

