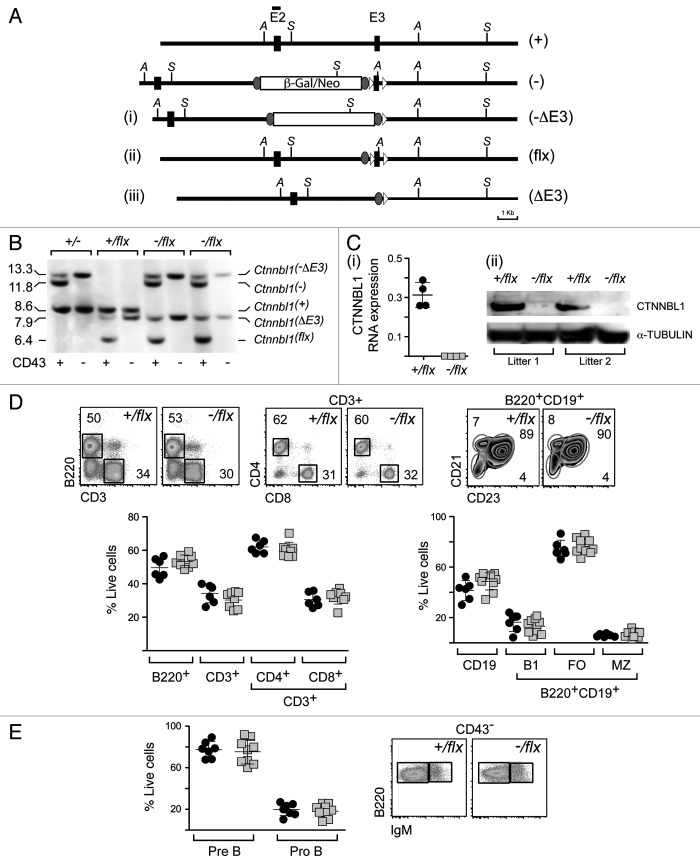
Figure 2. Lineage-specific ablation of Ctnnbl1 has little effect on B cell development. (A) B cell-specific inactivation of Ctnnbl1. The top two lines depict the wild type locus and the derivative containing a targeted β-gal/neo insertion into intron 2 as in Figure 1A. In alignment with these are depicted the loci obtained following (i) Cre-mediated excision of E3 (Ctnnnbl1-ΔE3; which will be inactive); (ii) following Flippase-mediated excision of the β-gal/neo cassette (Ctnnnbl1flx; which will be functional but a ‘floxable’ substrate for Cre-mediated inactivation) and (iii) both Flippase – and cre-mediated excision (yielding Ctnnnbl1ΔE3; which will be inactive). (B) Southern blot analysis of DNA extracted from sorted splenic CD43- cells (which comprise > 95% resting B cells) as well as CD43+ cells (which comprise T cells, granulocytes/macrophages and activated B cells) from mice of the indicated Ctnnbl1 genotypes that also express Cre recombinase under control of the B-cell-specific mb1 promoter. Ase I-digested DNA was hybridized with a Ctnnbl1 E2 probe. The origins of the various hybridizing bands are indicated with the results revealing highly (> 95%) efficient deletion of Ctnnbl1 E3 in the resting B cells of mb1-Cre Ctnnbl1-/flx mice. Some deletion of Ctnnbl1 E3 is also observed within the CD43+ fraction, which probably reflects activated B cells within this population. (C) Loss of CTNNBL1 expression in the sorted splenic B cells of mb1-Cre Ctnnbl1-/flx mice as judged by (i) RT-PCR analysis of RNA using primers specific for Ctnnbl1 E3 relating to HPRT (as a control) and (ii) western blot analysis of protein using α-tubulin as a control. (D) Comparison of splenic B and T cell populations in mb1-Cre Ctnnbl1-/flx mice (squares) as compared with mb1-Cre Ctnnbl1+/flx controls (circles). T cells were identified as CD3+ and subdivided into CD4+ and CD8+ single-positive subpopulations. B cells were identified as B2220+ or CD19+ with B220+ CD19+ cells divided into B1 (CD23- CD21-); follicular (FO: CD23high CD21+) or marginal zone (MZ: CD23low CD21+) subpopulations. (E) Comparison of pre- and pro- B cell populations in the bone marrow of mb1-Cre Ctnnbl1-/flx mice (squares) as compared with mb1-Cre Ctnnbl1+/flx controls (circles). Pre-B cells were defined as CD43- B220+ IgM- whereas pro-B cells are as CD43- B220+ IgM+.

An official website of the United States government
Here's how you know
Official websites use .gov
A
.gov website belongs to an official
government organization in the United States.
Secure .gov websites use HTTPS
A lock (
) or https:// means you've safely
connected to the .gov website. Share sensitive
information only on official, secure websites.
