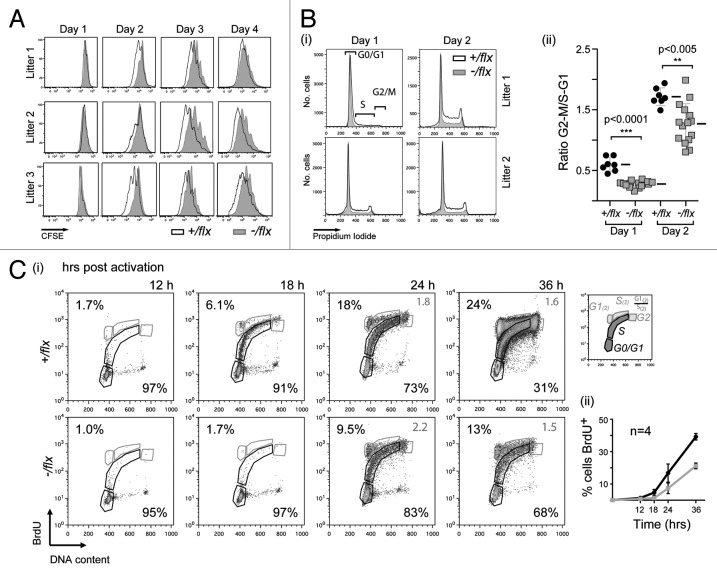
Figure 4. CTNNBL1-deficient B cells are slow to enter their first S-phase on LPS activation. (A) Clonal expansion of splenic B cells from three littermate pairs of mb1-Cre Ctnnbl1-/flx and control mice as monitored by CFSE dilution. (B) Cell cycle analysis of splenic B cells from multiple littermate pairs of mb1-Cre Ctnnbl1-/flx and control mice as analyzed at 24 and 48 h of incubation with LPS/IL4. (i) The propidium iodide staining profiles of the cells from two littermate pairs are shown on the left with (ii) the results from multiple animals summarized on the right. The proportion of cells per stage of the cell cycle is normalized to the average number of cells in the controls within each independent experiment (bars indicate mean and sd). (C) DNA synthesis in splenic B cells from littermate pairs of mb1-Cre Ctnnbl1-/flx and control mice cultured for the indicated lengths of time with bromodeoxyuridine (BrdU) and LPS. (i) Cells were analyzed for BrdU content by staining with anti-BrdU antibody and total DNA content by propidium iodide staining. The individual staining profiles are indicated (percent of cells in G0/G1 and S phase in black, with the ratio of cells in G1 vs. S that have entered a second cell division in gray) with (ii) a separate graph showing the percentage of cells that have incorporated BrdU at the various time points in four pairs of littermates.

An official website of the United States government
Here's how you know
Official websites use .gov
A
.gov website belongs to an official
government organization in the United States.
Secure .gov websites use HTTPS
A lock (
) or https:// means you've safely
connected to the .gov website. Share sensitive
information only on official, secure websites.
