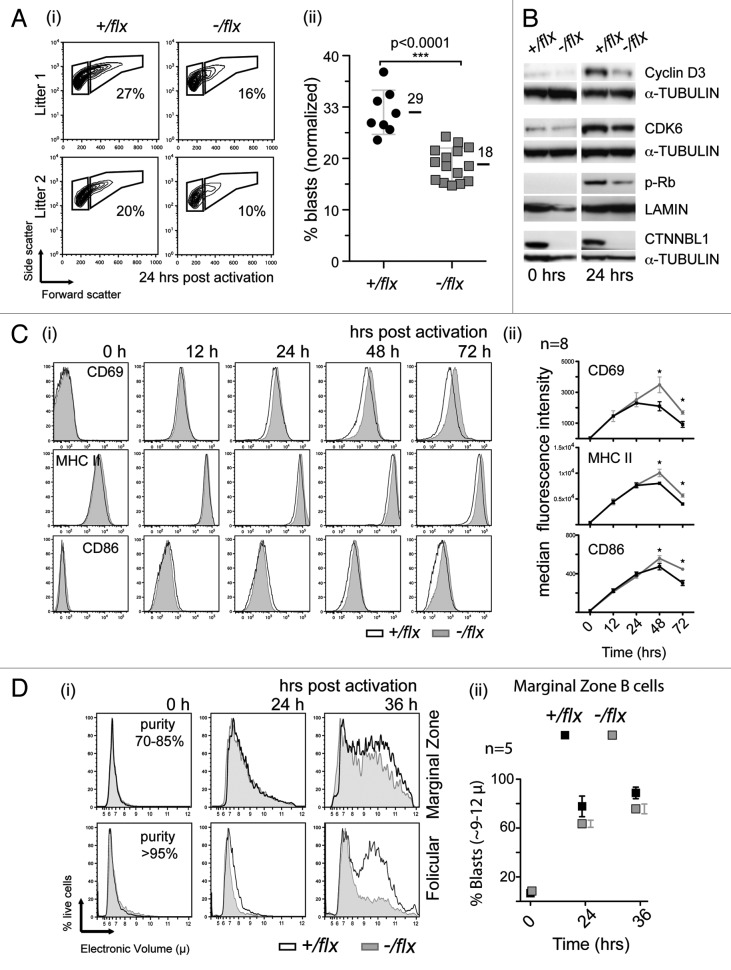
Figure 5. CTNNBL1 deficiency delays cell enlargement and S-phase entry but not the upregulation of early activation markers. (A) Comparison of blasting of splenic B cells from littermate pairs of mb1-Cre Ctnnbl1-/flx and control mice after 24 h of incubation with LPS as monitored by cell scatter analysis. (i) Individual contour plots of live cells from two of the littermates pairs with the gating for blasts vs. resting cells indicated. (ii) Percentage of large cells (blasts) gate in multiple B cell cultures 24 h post activation (mean and sd are indicated). (B) Induction of expression of cyclin D3, CDK6 and phosphorylated Rb after 24 h of incubation with LPS as monitored by western blot analysis. The abundance of lamin and α-tubulin served as loading controls. (C) Surface expression of CD69, CD86 and MHC class II on splenic B cells from littermate pairs of mb1-Cre Ctnnbl1-/flx and mb1-Cre Ctnnbl1+/flx control mice as analyzed after various times of incubation with LPS. (i) Histogram plots from a representative experiment and (ii) line graphs depicting the median fluorescence intensity at each time point derived from eight experiments. (Averages and sds are indicated). (D) Comparison of the blasting of splenic follicular and marginal zone B cells following LPS activation. The B cells were obtained from CD19-Cre Ctnnbl1-/flx and CD19-Cre Ctnnbl1+/flx control mice [with the CD19-Cre giving, like the mb1-Cre, efficient B cell-specific deletion of Ctnnbl1 (Fig. S1)]. (i) Histogram plots depicting the electronic volumes of sorted follicular and mantle zone B cells. The purity (assessed by flow cytometry of surface markers) of the sorted populations at the start of the cultures is indicated. (ii) The proportion of marginal zone B cells with diameter > 9 µ at different times post stimulation in multiple samples (means and sem shown).

An official website of the United States government
Here's how you know
Official websites use .gov
A
.gov website belongs to an official
government organization in the United States.
Secure .gov websites use HTTPS
A lock (
) or https:// means you've safely
connected to the .gov website. Share sensitive
information only on official, secure websites.
