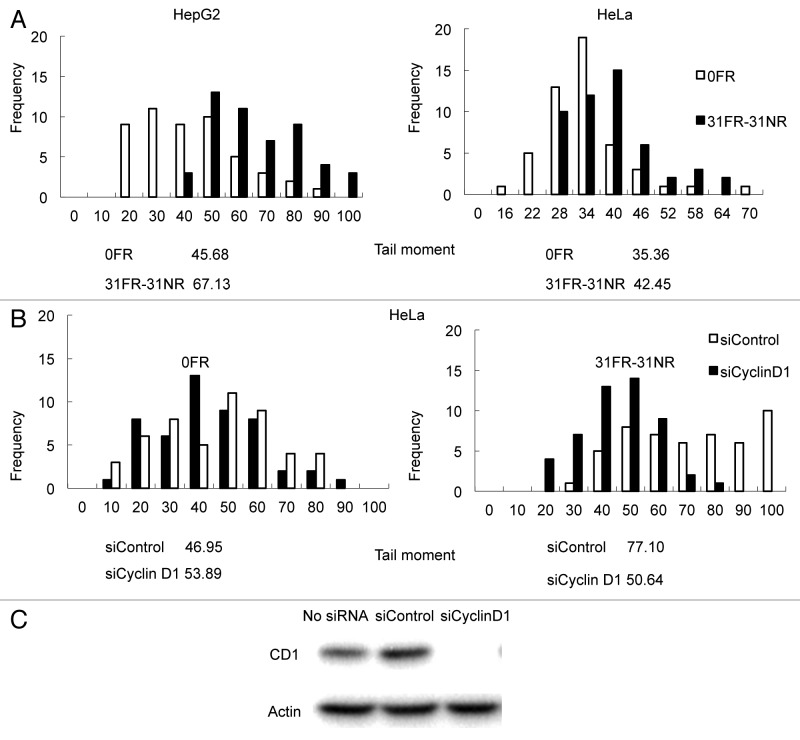
Figure 2. Results for neutral comet assays. (A) Distributions of tail moment values for 0FR and 31FR-31NR cells. Results for HepG2 and HeLa cells are shown in the left and right panels, respectively. The median tail moment values are indicated at the bottom of the graph. (B) Distributions of tail moment values for 0FR and 31FR-31NR cells derived from the HeLa cell line. Samples were prepared at 48 h after transfection with control siRNA (siControl) or cyclin D1 siRNA (siCyclin D1). Median tail moment values are indicated at the bottom of the graph.

An official website of the United States government
Here's how you know
Official websites use .gov
A
.gov website belongs to an official
government organization in the United States.
Secure .gov websites use HTTPS
A lock (
) or https:// means you've safely
connected to the .gov website. Share sensitive
information only on official, secure websites.
