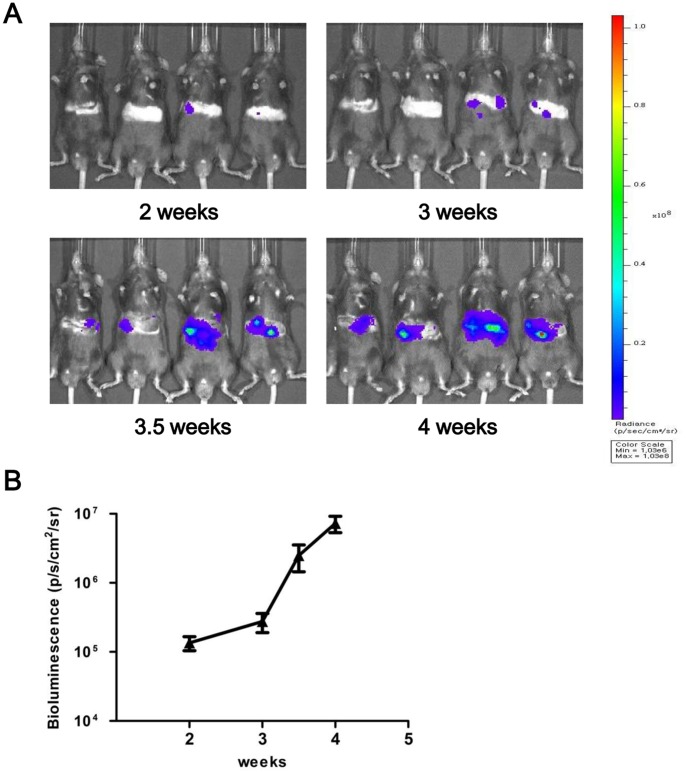
Figure 4. Repeated BLI of the same mice following hydrodynamic injection.
(A) Pseudocolor images of tumor growth in the liver following hydrodynamic injection of HrasG12V and shp53. Note the continuous increases in the signals from the abdominal regions of the same mice. (B) Average bioluminescence signals from the abdominal regions of the same mice at the indicated time points PHI.

