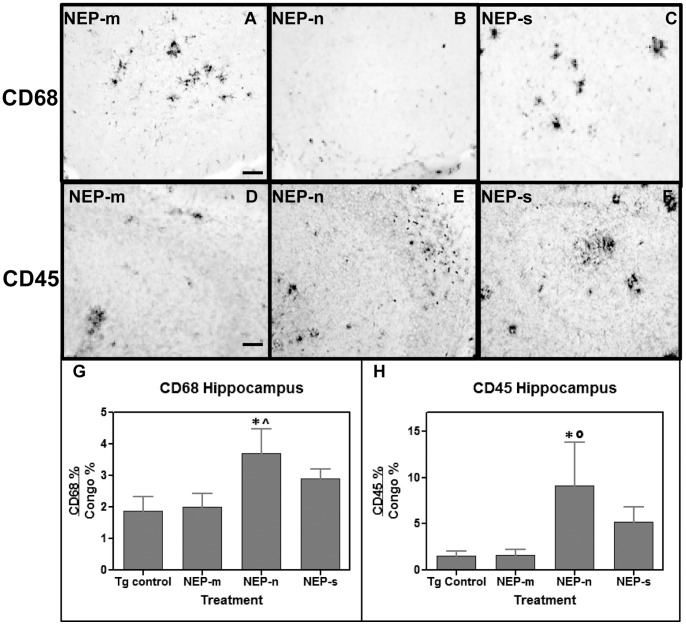
Figure 8. Study 3: CD68 (A-C) and CD45 (D-F) immunostaining is observed throughout the hippocampus of study mice.
In the hippocampus, no significant differences are observed in the amount of total CD68 staining between the NEP-n, NEP-s, and NEP-m groups, but CD45 staining in NEP-s treated mice is greater than CD45 staining in NEP-m treated mice. Scale bar = 50 µm. Panels G and H present ANOVA analysis of the ratio of CD68 to congophilic staining, and of the ratio of quantitated CD45 to congophilic staining, respectively, in the hippocampus of study mice. The (*) indicates significance compared to NEP-m mice with p<0.05, and the (∧) indicates significance compared to Tg control mice with p<0.05 or p<0.01 (°).Tg control (n = 9), NEP-n (n = 4), NEP-m (n = 7), NEP-s (n = 6).

