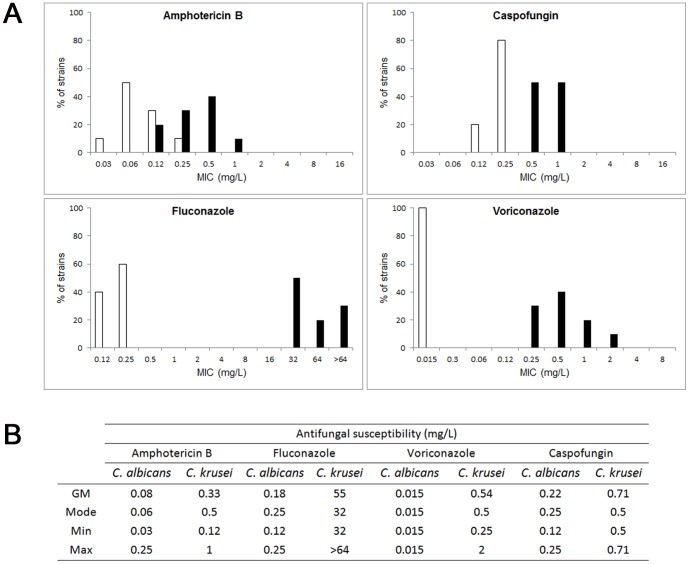
Figure 4. Antifungal susceptibility profile of C. krusei and C. albicans.
A) Distribution of MIC values (n = 10) to amphotericin B, caspofungin, fluconazole and voriconazole of C. albicans (white bars) and C. krusei (black bars). B) Description of antifungal susceptibility of C. albicans and C. krusei to different antifungals. N = 10. The geometric mean (GM), mode, minimum (Min) and maximum (Max) are shown.

