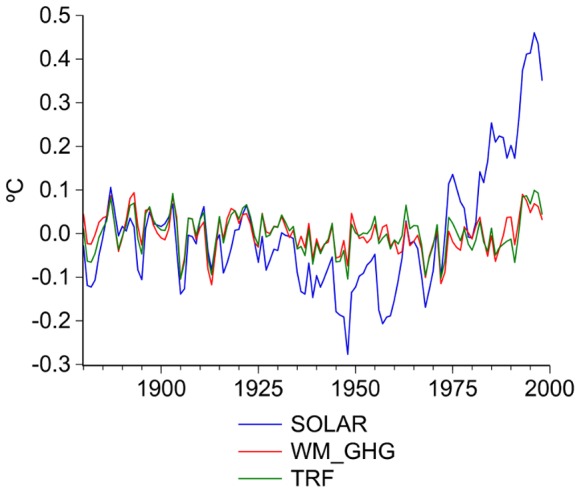
Figure 6. Residuals of the regressions of  on SOLAR, TRF and WM_GHG.

 is the average of models runs; WM_GHG includes carbon dioxide, methane, nitrous oxide and chlorofluorocarbons; SOLAR is solar forcing; TRF includes WM_GHG, solar irradiance, reflective tropospheric aerosols, indirect effect of aerosols, ozone stratospheric water vapor, land use change, snow albedo and black carbon.
