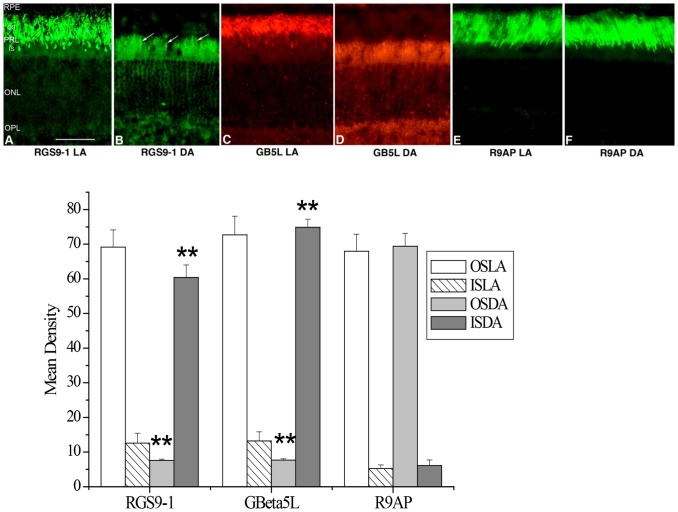
Figure 1. RGS9 and Gβ5L show different distribution in mouse rods in light (LA) and dark adaptation (DA).
Upper panel: Immunostaining of RGS9 (A and B), Gβ5L (C and D) and R9AP (E and F) in 200 lux light adapted (A, C and E) and dark adapted (B, D and F) mouse retinas. Arrows indicate labeling of RGS9 in the rod inner segments. RPE = Retinal Epithelium Layer; PRL = Photoreceptor Layer; OS = outer segment; IS = Inner Segment; ONL = Outer Nuclear Layer; OPL = Outer Plexiform Layer; bar = 25 µm. Lower panel: Analysis of the average levels of RGS9-1, Gβ5L and R9AP in the outer segment layer (OS) and inner segment layer (IS). OSLA = outer segment in light adapted condition; ISLA = inner segment in light adapted condition; OSDA = outer segment in dark adapted condition; ISDA = inner segment in dark adapted condition; n = 8; **P<0.001 dark adaptation vs light adaptation.

