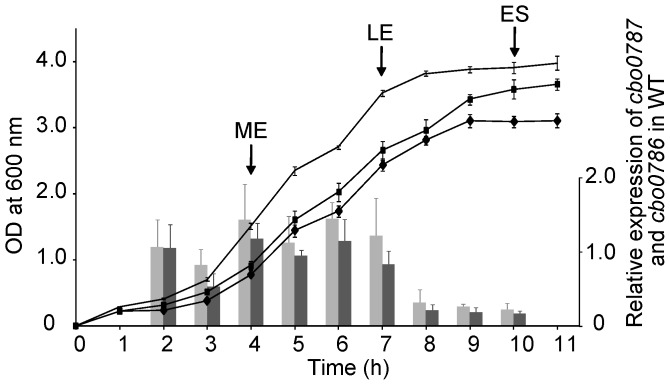
Figure 2. Expression of cbo0787 and cbo0786 in C. botulinum ATCC 3502 wild type (WT) and the growth curves of WT and the cbo0787 and cbo0786 mutants.
Quantitative RT-PCR analysis of relative cbo0787 (light grey bars) and cbo0786 (dark grey bars) transcript levels in WT. Target gene expression was normalized to 16S rrn and calibrated to 2-hour time point. Growth of WT (line without symbols), cbo0787 mutant (square) and cbo0786 mutant (diamond) in tryptose-peptone-glucose-yeast extract medium. Arrows indicate sampling at mid-exponential (ME), late exponential (LE) and early stationary (ES) growth phases. Error bars represent standard deviations of three replicate measurements.

