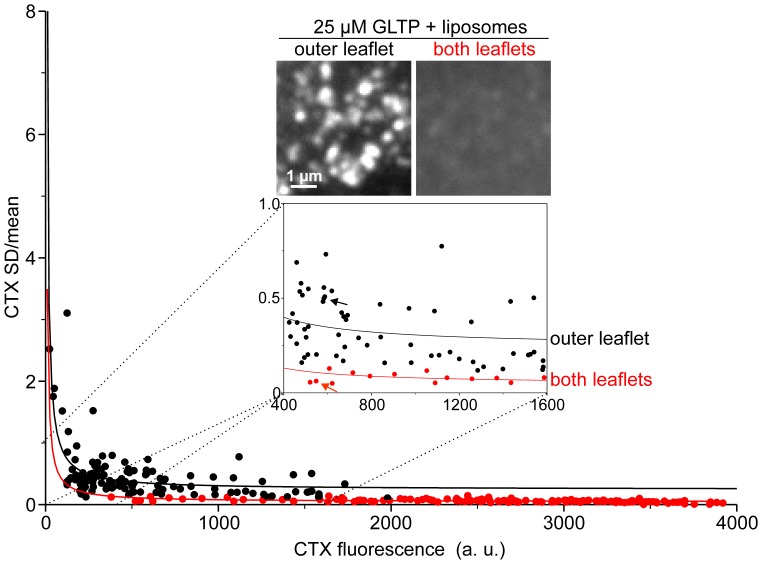
Figure 3. GM1 in the inner leaflet is more uniformly distributed.
The degree of clustering of the CTX staining was analyzed on membrane sheets from experiments shown in Fig. 2 by calculating the relative SD (SD/mean). For each membrane sheet, SD/mean was plotted against the mean fluorescence and a function (y = y0+ a/x) was fitted (with values for “outer leaflet” y0 = 0.2437; a = 62.0138 and for “both leaflets” y0 = 0.0454; a = 34.49). The higher the value of the relative mean, at a comparable GM1 concentration, the more clustered the signal [39]. Loading of the outer leaflet (black dots) results in overall higher values than loading of both leaflets (red dots). Arrows point to the values obtained for the membranes shown for illustration. For each condition, membrane sheets from all independent experiments were pooled (128 and 140 membrane sheets for loading of the extracellular and both leaflets, respectively).

