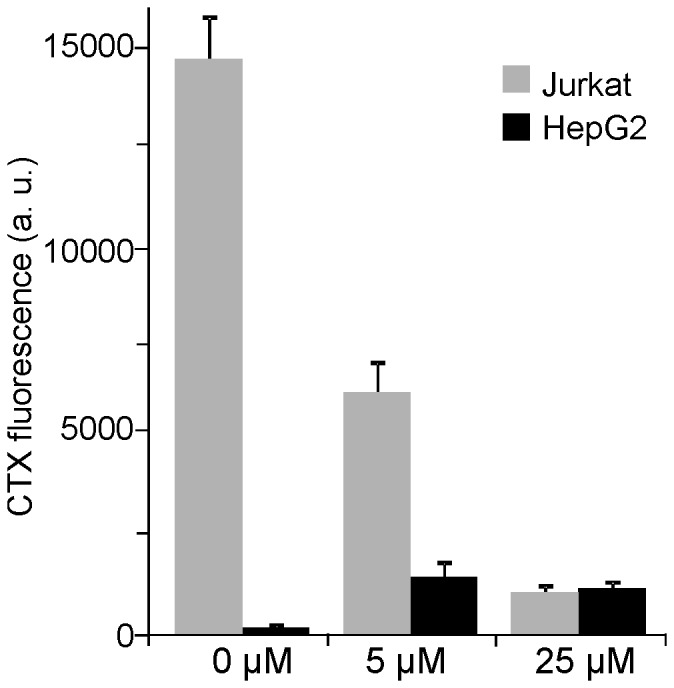
Figure 8. Transfer of Jurkat cell GM1 to membrane sheets from HepG2 cells.

GLTP solutions from Jurkat cell membrane treatments (Fig. 7; 30 min at 37°C) were collected and added to HepG2 membrane sheets. After 30 min at 37°C GM1 was visualized by CTX staining and imaged. The bar chart represents quantified CTX fluorescence of Jurkat cell membranes (from the experiment shown in Fig. 7) and HepG2 cell membranes. Jurkat cell membranes and HepG2 membranes were recorded with 100 ms and 1 s, respectively. To allow a direct comparison of the GM1 levels, the presented HepG2 values were divided by a factor of 10 assuming that the recorded intensity is linear to the exposure time. In controls, Jurkat cells had a 74-fold higher GM1 concentration than HepG2 cells. Values are given as means ± SEM (n = 3 independent experiments; 113 - 316 membrane sheets analyzed for each experiment).
