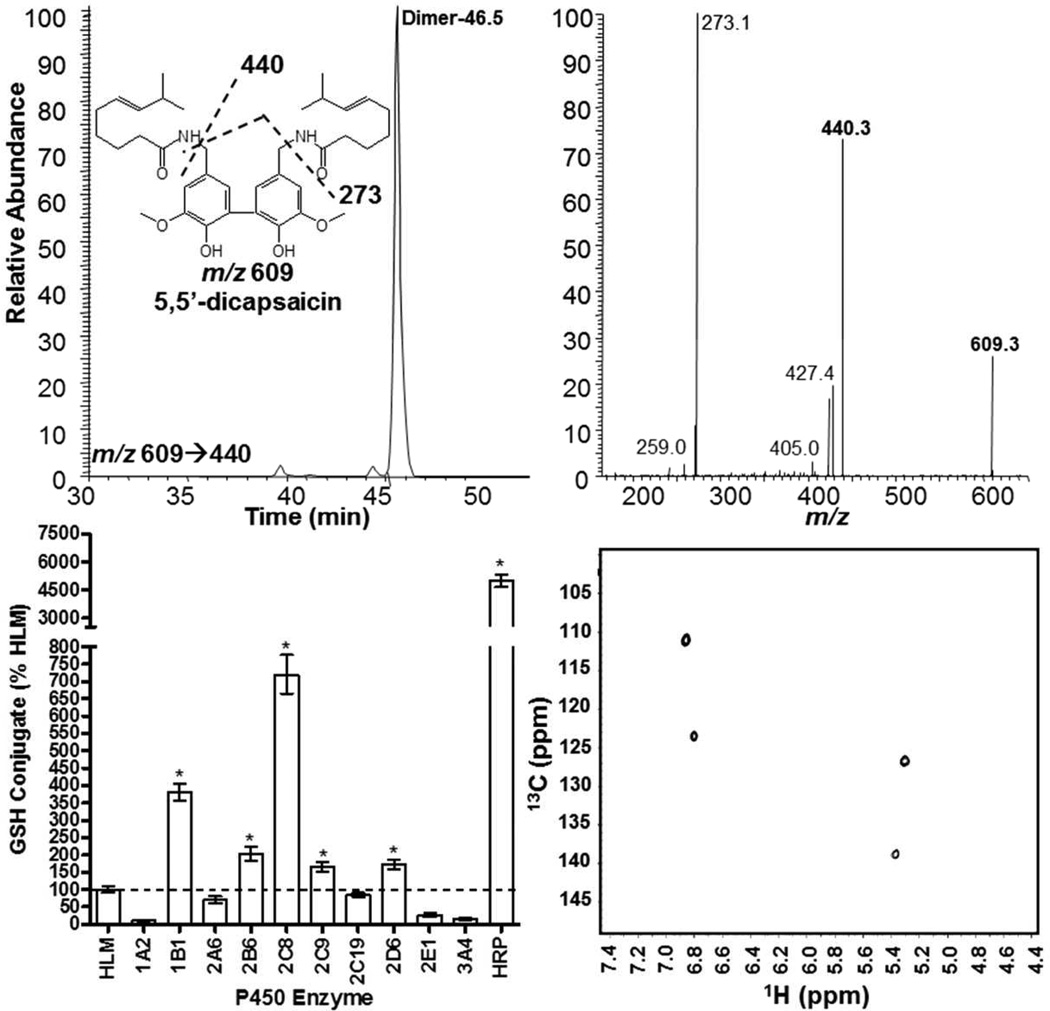
Figure 6.
Chromatographic, spectral, and enzyme-specific production of 5,5’-dicapsaicin by human P450 enzymes and horseradish peroxidase. The top panel shows an extracted ion LC/MS2 chromatogram and the corresponding MS2 spectrum with illustrated fragmentation pathways for 5,5’-dicapsaicin (m/z 609). The bottom left panel shows quantitative results for the formation of 5,5’-dicapsaicin by individual human P450 enzymes and horseradish peroxidase. The bottom right panel shows the gHSQC spectrum used to confirm 5,5’-dicapsaicin. *Represents dimer production in excess of the quantity produced by human liver microsomes using ANOVA and p<0.05. Reactions were prepared as described under the methods section.

