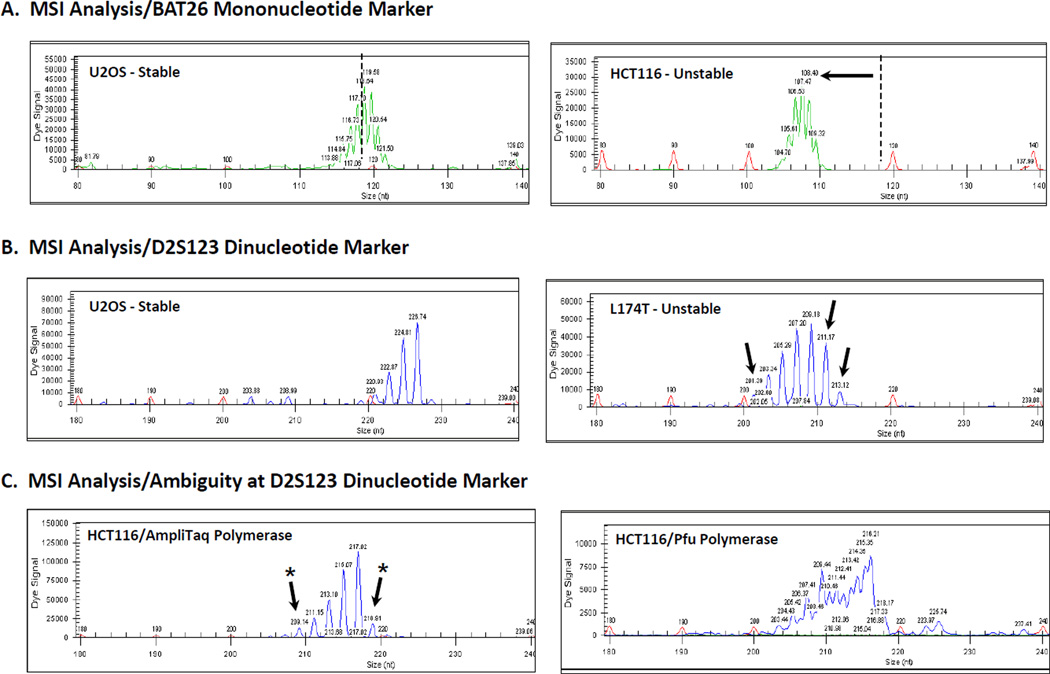
Figure 1. MSI Analysis of MMR+ and MMR- cell lines at the BAT26 and D2S123 loci.
PCR reactions were performed using genomic DNA isolated from MMR+ U2OS and MMR-HCT116 or L174T cell lines and primer sets in which one primer was labeled with WellRED D3 dye (BAT26) or WellRED D4 dye (D2S123). The amount of input DNA, MgCl2 concentration, and annealing temperature were optimized for each primer set. PCR products and size standards were mixed with formamide, run on a Beckman Coulter CEQ 8000 system, and analyzed using the Fragment Analysis software. A. MSI analysis using the BAT26 marker. DNA from U2OS cells shows stability at the quasimonomorphic locus with a fragment of 119nt (PCR stutter bands are also evident). DNA from MMR-deficient HCT116 cells display instability with a shift to a smaller allele size. B. MSI analysis using the D2S123 marker. DNA from U2OS cells is homozygous and stable for this allele, but DNA from MMR− L174T show extra alleles as indicated by the arrows. C. Ambiguity at the D2S123 marker. Amplification of DNA from HCT116 cells showed minor new alleles (arrows with asterisk) that were not resolved upon utilizing a proofreading-proficient DNA polymerase in the PCR reaction.

