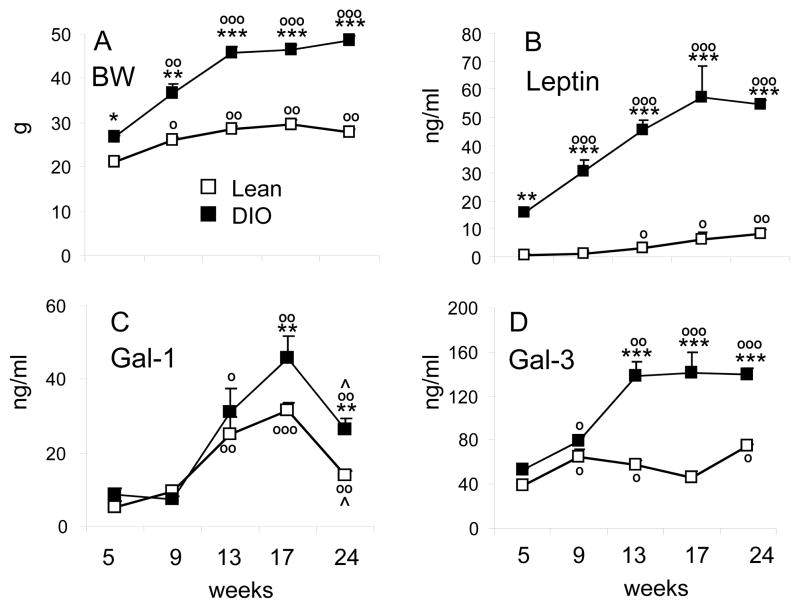
Figure 1. Time course of HFD-induced changes in body weight, serum leptin, Gal-1 and Gal-3.
Mice were fed regular chow (Lean, open squares) or HFD (DIO, black squares) for 5, 9, 13, 17 or 24 weeks. Body weight (A), serum leptin (B), Gal-1 (C) and Gal-3 (D) were measured at the indicated time points. Data are mean +/−SEM of 5–10 mice per group. *p<0.05, **p<0.01, ***p<0.001 vs lean at matching age; op<0.05, oop<0.01, ooop<0.001 vs respective 5 weeks; ^p<0.05 versus respective 17 weeks.

