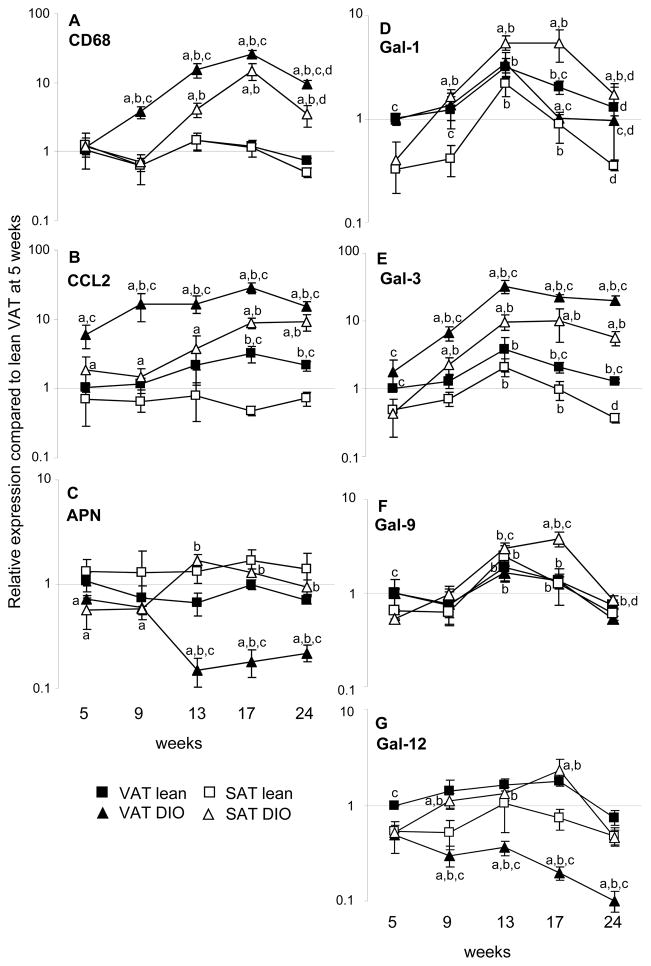
Figure 2. Time course of HFD-induced changes in expression of galectin mRNA in VAT and SAT.
Mice were fed regular chow (Lean, squares) or HFD (DIO, triangles) for 5, 9, 13, 17 or 24 weeks. Expression of CD68 (A), CCL2 (B), Adiponectin (APN) (C), Gal-1 (D), Gal-3 (E), Gal-9 (F), and Gal-12 (G) was evaluated by qRT-PCR in VAT (black symbols) and SAT (open symbols). Data are reported as gene expression relative to Lean VAT at 5 weeks using the ΔΔct method. Data are mean +/−SEM of 5–10 mice per group. ap<0.01 vs respective tissue in lean mice at same time point; bp<0.01 vs respective tissue at 5 weeks;, cp<0.01 vs respective SAT at same time point;; dp<0.01 vs respective tissue at 13–17 weeks.

