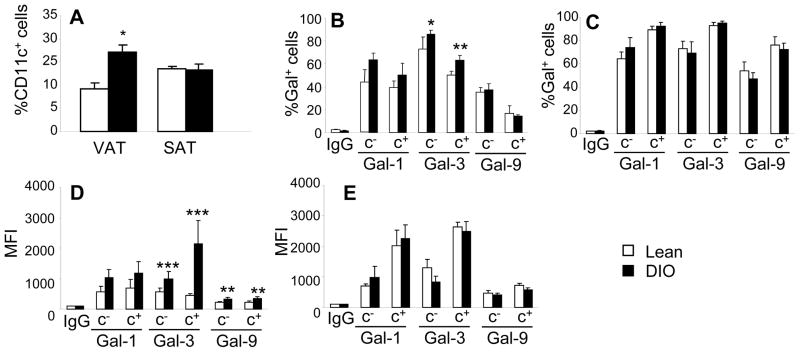
Figure 4. Characterization of galectin-producing cells in VAT and SAT of lean and DIO mice.
Mice were fed regular chow (Lean, open columns) or HFD (DIO, black columns) for 13 weeks. Panel A: Percentage of CD11c+ cells in the F4/80+ population of VAT and SAT in lean and DIO mice. Panels B–C: Percentage of Gal+ cells in the F4/80+/CD11c− (c−) and F4/80+/CD11c+ (c+ ) population of VAT (B) and SAT (C). Panel D–E: Median Fluorescence Intensity (MFI) of Gal+ cells in the F4/80+/CD11c− (c−) and F4/80+/CD11c+ (c+ ) population of VAT (D) and SAT (E). DIO. Data are expressed as fold-increase in MFI versus respective IgG isotype. Data are mean +/−SEM of 8 mice per group.*p<0.05, **p<0.01, ***p<0.001 vs respective lean.

