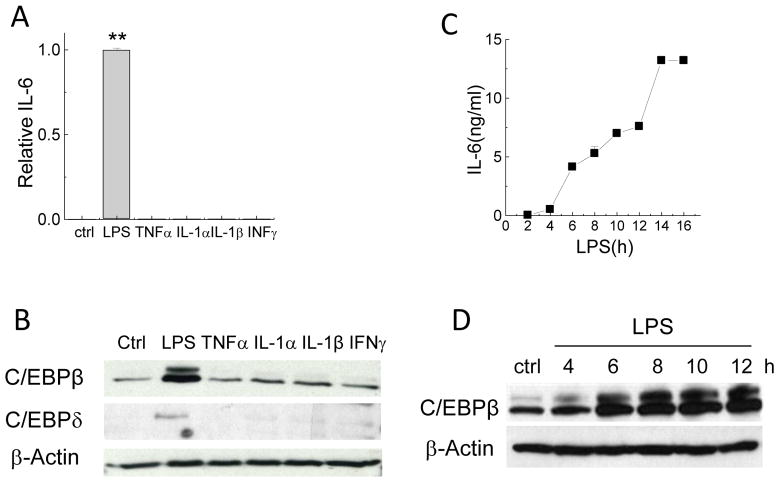
Figure 4. LPS but not individual cytokines was capable of inducing IL-6 and LPS-induced C/EBPβ upregulation paralleled IL-6 in a time-dependent manner.
Panels A and B: RAW cells were stimulated with LPS (0.1μg/ml) or TNFα (10ng/ml), IL-1α (10ng/ml), IL-1β (10ng/ml), or INFγ (100ng/ml) for 16 h. Ctrl is no-stimulus control. Media was collected for IL-6 and cells were collected for Western blotting. **P<0.01 is the difference between LPS- and individual cytokine-treated cells. Panels C and D: RAW cells were stimulated with LPS for indicated times (h) and IL-6 (ng/ml) in the media was measured by ELISA. Total proteins from the cells were immunoblotted for C/EBPβ, C/EBPδ or actin. The relative IL-6 is the ratio of IL-6 secreted by cells treated with different stimuli to that of LPS-treated cells. Data are shown as mean±SD (n >2 per bar).

