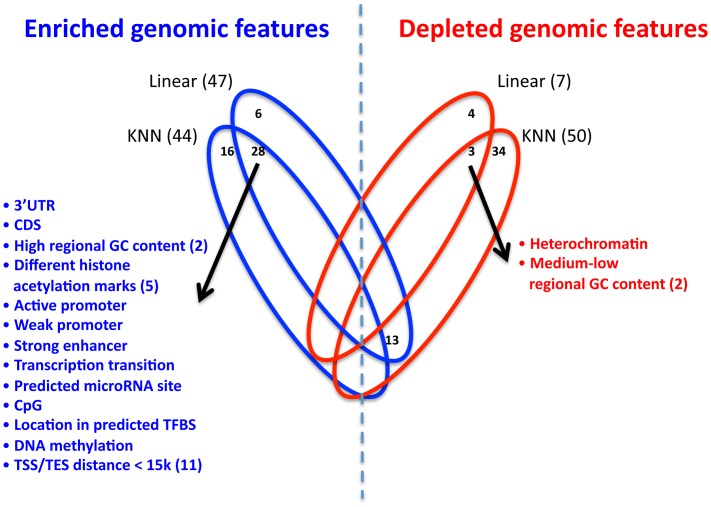
Figure 6. Enrichment and depletion of different genomic features in the multi–SNP models.
Venn diagram showing the number of significantly enriched (blue) or depleted (red) genomic features in the extended KNN algorithm and the regularized linear model. For each model, the number of significant genomic features appears in parenthesis, and non-zero intersections are shown in the appropriate location. The list of respective genomic features (enriched or depleted) is depicted, and the number in parenthesis represents the actual number of different genomic features in the group.

