
Figure 3.
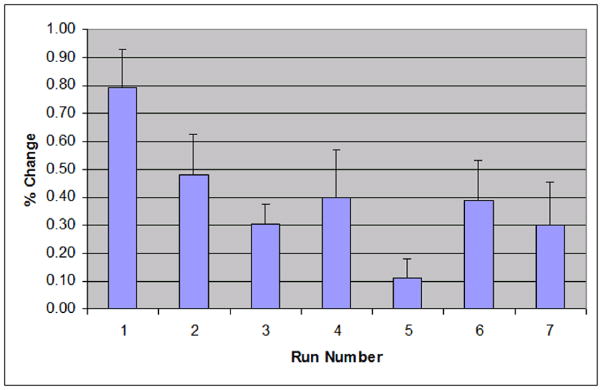
The average percent change in a 3×3×3 voxel region of interest in the S1/M1 area across 7 runs of all subjects. The error bars represent one standard error.
Official websites use .gov
A
.gov website belongs to an official
government organization in the United States.
Secure .gov websites use HTTPS
A lock (
) or https:// means you've safely
connected to the .gov website. Share sensitive
information only on official, secure websites.
The average percent change in a 3×3×3 voxel region of interest in the S1/M1 area across 7 runs of all subjects. The error bars represent one standard error.