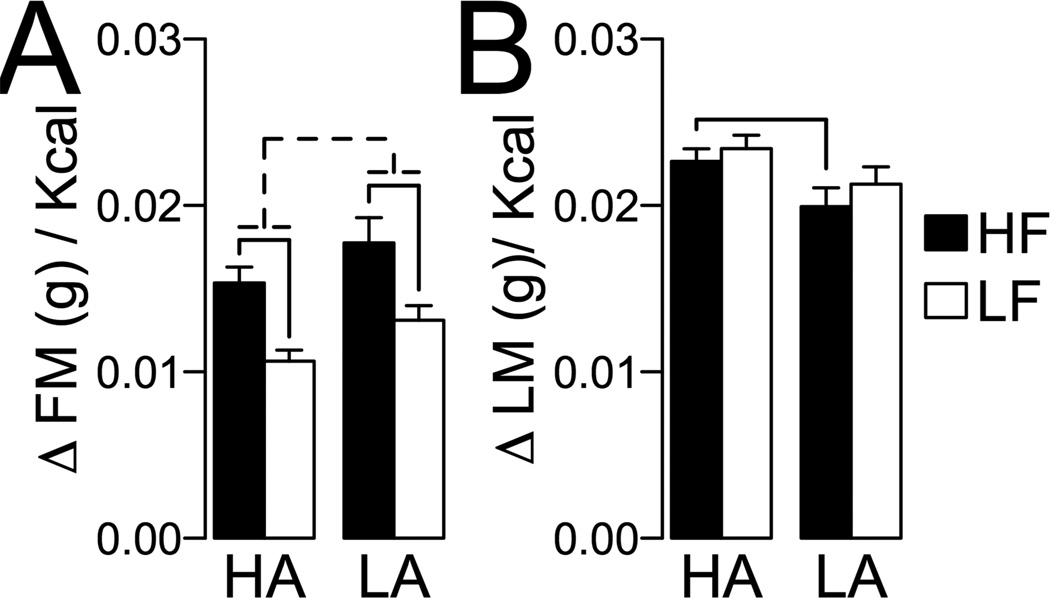
Figure 6. Feeding efficiency in high activity (HA) and low activity (LA) rats.
Feeding efficiency was calculated as necessary to (A) gain of fat mass (g/ kcal or (B) gain of lean mass (g)/kcal. Full line: P ≤ 0.05 for pairwise comparisons corrected for multiple comparisons (See Methods, Statistical Analysis). For (A), broken line indicates significant main effect of the HA/LA phenotype by ANCOVA (See Results).

