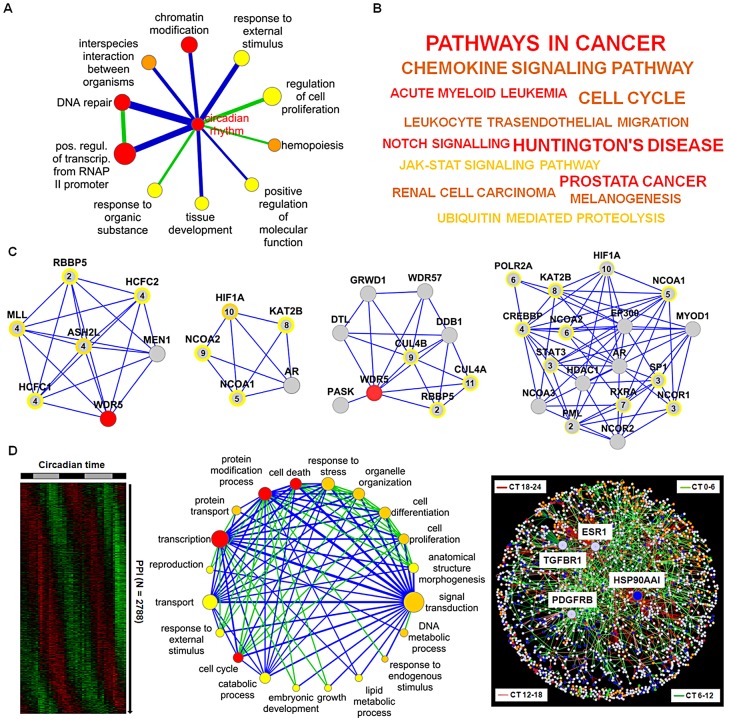
Figure 6. Prediction of Circadian Output Regulation.
(A) Coupling of biological processes via predicted dynamic PPIs. Node size: number of genes in GO category (significance (FDR<0.25, <0.01 and <0.0001 from yellow to red). Edge width and color: number of interactions and enrichment in dynamic interactions (blue: p<0.001; green: p<0.1) (for details see main text and Text S1). (B) KEGG pathway analysis of network neighborhood. From yellow to red (p<0.02, <0.0005 and <0.0002). Font: number of components in each category. (C) Highly connected clusters. Modules with histone methyltransferase complex, transcription coactivator activity, response to DNA damage stimulus and histone acetyltranferase activity as significant GO terms (left to right). Peak expression times are given within circles (see Figure S6A for all modules identified). (D) Left: Predicted dynamic PPIs within the liver (see Figure S6B). Middle: coupling of biological processes via predicted dynamic interactions in the liver. Node color: significant dynamic interactions (p<0.25, <0.0001, p<10−8 from yellow to red); edge color: enrichment in dynamic interactions (blue: p<10−16; green: p<10−5). Right: dynamic global PPI network. Node color: most significant biological processes, i.e. cell cycle (green), cell death (red), protein modification (yellow), signal transduction (blue) and transcription (orange).

