
Figure 2. Testing the radiation model’s theoretical predictions on commuting trips extracted from the US census dataset.
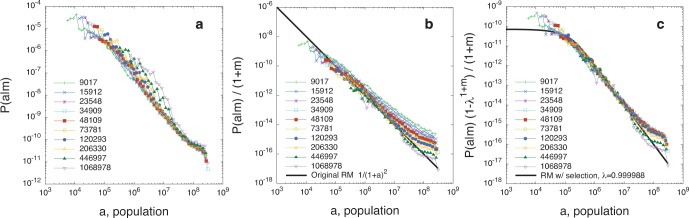
a) We divide the commuting flows in deciles according to the population of the origin county,  , and for each set we calculate the distributions
  . The values in the key indicate the mean origin population,
  , of each decile. We use the population as a proxy to estimate the number of employment opportunities in every county,
  , assuming in first approximation a linear relationship between population and job openings. b,c) The collapse of the distributions
  on the theoretical curves Eqs. (3) and (5) predicted by the original radiation model and the radiation model with selection respectively. (See the section Materials and Methods for details).