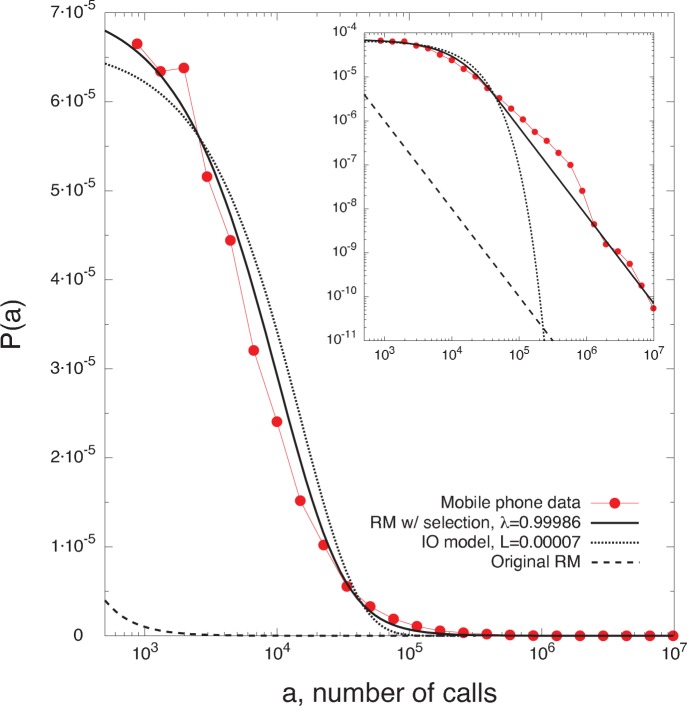
Figure 3. Testing the mobility models on trips extracted from a mobile phone dataset.
We analyze all call records collected during one day, and we define a trip when we observe two consecutive calls by the same user from two different towers. We define the variable  , representing the number of possible points of interest in a circular area
  centered at a given cell tower, as the total number of calls placed from the towers in
  , assuming that a location’s attractiveness is proportional to its call activity. We then calculate the empirical distribution
  , i.e. the fraction of trips to the towers between
  and
and  (red circles), and we compare it to the various models’ theoretical predictions
  , with
  defined in Eqs. (??), (4), and (3), and whose parameters,
  and
and  , are obtained with least-squares fits (black lines). In the inset we show the plot in a log-log scale. (See the section Materials and Methods for details).

