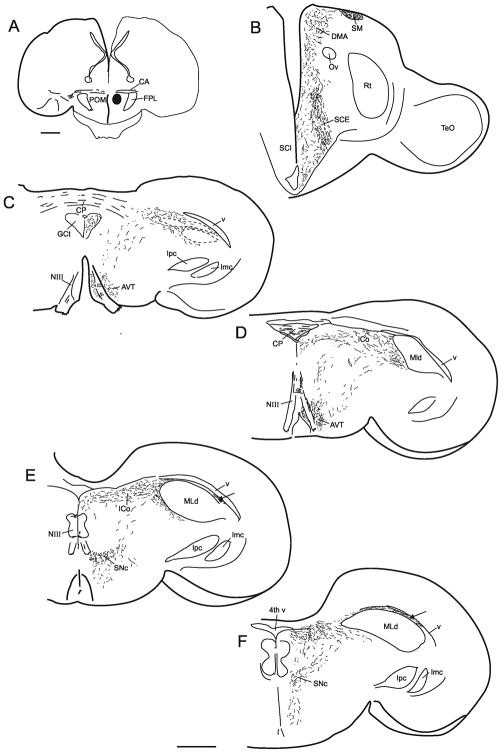
Figure 8.
A–F: Schematic hemisections depicting the projections (short fine lines and dots) resulting from a BDA injection in POM, shown as black in A and photomicrographically in figure 9. Arrows in E and F point to fibres and terminations lateral to MLd. The two areas enclosed by dashed lines in C receive little or no labeling. The more dorsal area is DM, the more ventral one receives input from the arcopallium – see figure 9. Scale bars = 1 mm.

