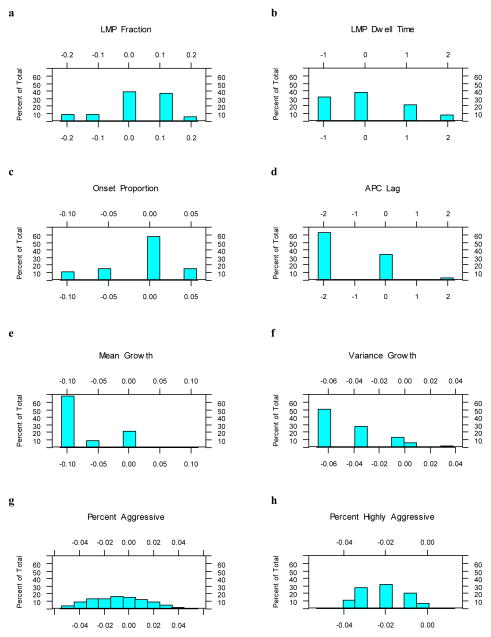
Fig. 4.
Histogram (percent of total) of the posterior distribution for the differences in parameters between the two race models (whites – blacks). (a) LMP Fraction; (b) LMP Dwell Time; (c) Onset Proportion; (d) APC Lag; (e) Mean Growth; (f) Variance Growth; (g) Percent Aggressive; (h) Percent Highly aggressive. Horizontal axes represent the difference in parameter values, whites minus blacks.

