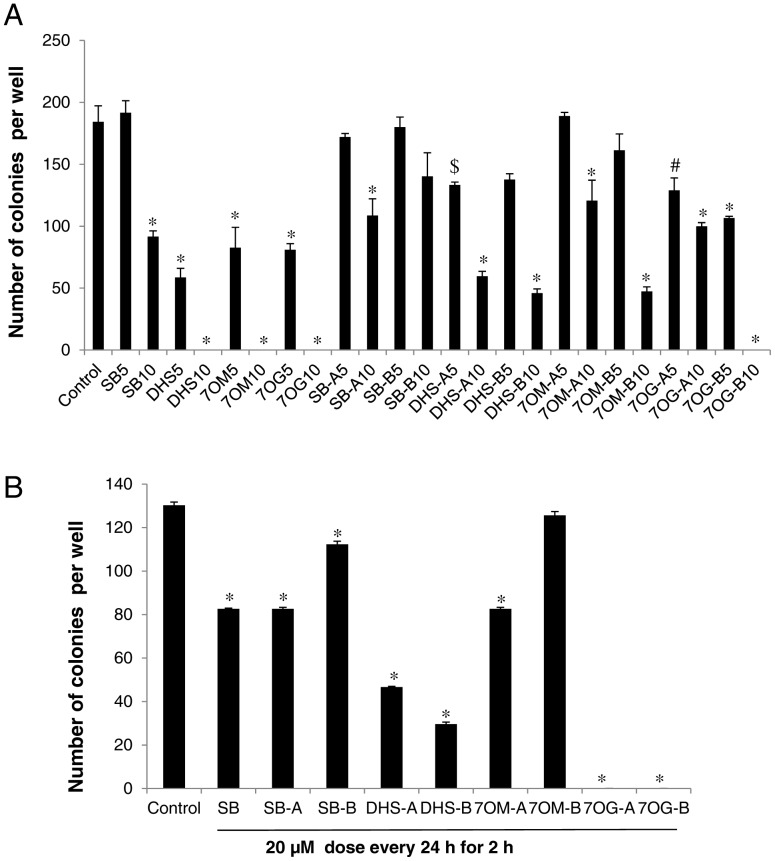
Figure 4. Effect of racemic mixtures and pure optical isomers of silybin and its derivatives on colony formation by HTB9 cells.
(A) HTB9 cells (∼1000 cells) were plated in 6 well plates and treated every 72 h with 5 and 10 µM doses of silybin (SB), 2,3-dehydrosilybin (DHS), 7-O-methylsilybin (7OM), 7-O-galloylsilybin (7OG), silybin A (SB-A), 2,3-dehydrosilybin A (DHS-A), 7-O-methylsilybin A (7OM-A), 7-O-galloylsilybin A (7OG-A) or silybin B (SB-B), 2,3-dehydrosilybin B(DHS-B), 7-O-methylsilybin B (7OM-B), 7-O-galloylsilybin B (7OG-B). On 11th day, cells were processed and colonies with more than 50 cells were counted. (B) HTB9 cells (∼1000 cells) were plated in 6 well plates and treated for 2 h every 24 h with 20 µM dose of silybin (SB), silybin A (SB-A), 2,3-dehydrosilybin A (DHS-A), 7-O-methylsilybin A (7OM-A), 7-O-galloylsilybin A (7OG-A) or silybin B (SB-B), 2,3-dehydrosilybin B(DHS-B), 7-O-methylsilybin B (7OM-B), 7-O-galloylsilybin B (7OG-B). After 7 days, cells were processed and colonies with more than 50 cells were counted. In the bar diagrams, each data-point is representative of mean ± SD of 3 samples. *, p≤0.001; #, p≤0.01; $, p≤0.05.

