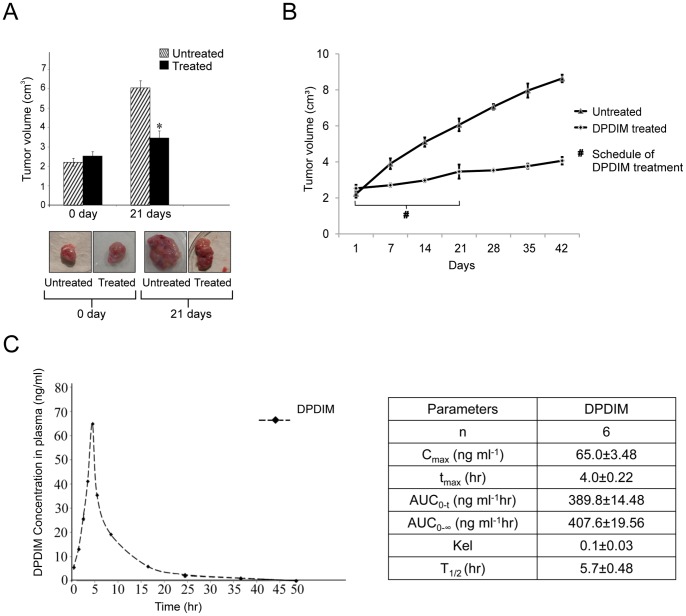
Figure 7. Reduction of breast tumor growth by DPDIM in animal model.
Six tumor bearing Sprague Dawley rats were taken for each of the DPDIM treated and untreated group and six normal rats were also taken as control. (A), Inhibition of DMBA-induced breast tumor growth after DPDIM (5 mg/kg) treatment for every alternative days upto 21 days in rats was shown. (n = 6 in each group). Data is represented as mean ± SEM and *indicates P<0.001. (B), Tumor growth curve of rats after oral administration of DPDIM for 21 days was represented in graph. Growth pattern of tumors for another 21 days after discontinuation of DPDIM treatment was also represented in graph. Representation of growth pattern of untreated tumors for 42 days is there in the graph. For each time point a group of 6 rats were taken. Bars represent standard deviation of the volume of tumors at each time point. (C), Time-course of plasma concentration over 48 hr following oral administration of 5 mg/kg DPDIM to the tumor bearing rats was shown in the figure. Mean compound concentration in rat (n = 6) plasma at each time point (at 0.5, 1, 2, 3, 4, 5, 8, 16, 24 and 48 hrs) was studied by HPLC analysis on a Shimadzu Model SPD-M10Avp equipped with LC-10ATvp HPLC pump, Hamamatsu Deuterium Lamp type L6585 photodiode array detector. Main parameters studied for this compound in rat was given in the inserted table. Cmax = Maximum plasma concentration of a drug after oral administration; tmax = Time to reach Cmax; AUC = Area under the curve; Kel = elimination rate constant and T1/2 = Biological half life.

