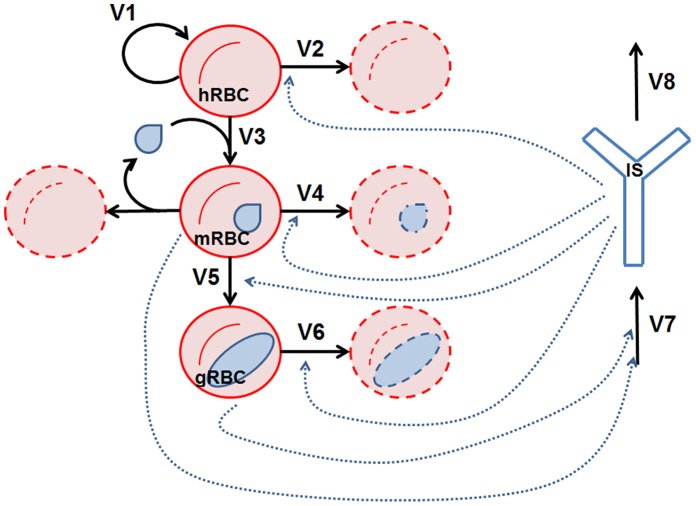
Figure 1. Erythrocyte infection model representation.
In the picture, red circles represent the red blood cells, blue drops represent merozoites, blue ovals represent gametocytes and the blue “Y” represents the immune system. The variable acronyms are the healthy red blood cells (hRBC), the merozoite-infected red blood cells (mRBC), the gametocyte-infected red blood cells (gRBC) and the immune system (IS). Black continuous arrows represent processes while blue dashed arrows represent regulatory influences of the variables on processes.

