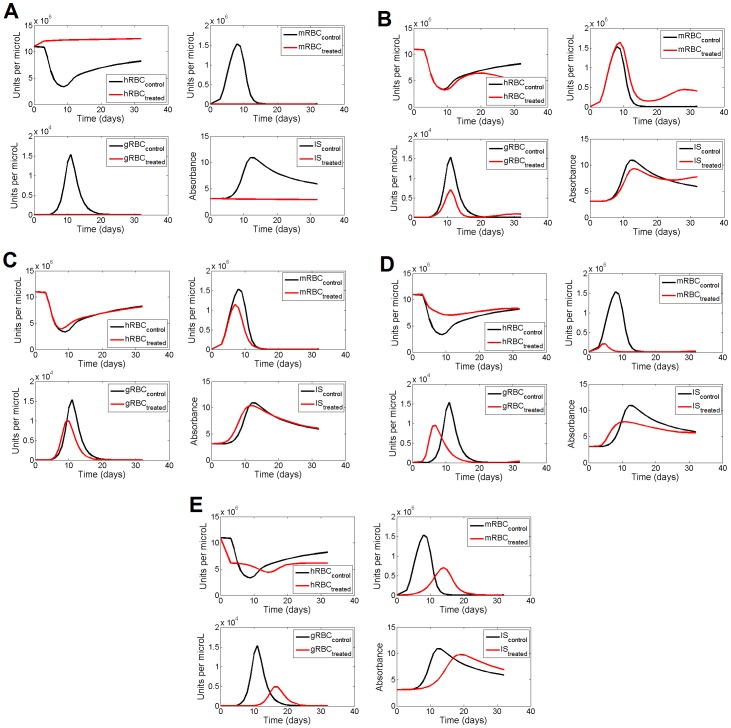
Figure 8. Model-based time course of the system variables after intervention on the selected target rate process.
A. After a decrease of V3 (γ3, 25 times the initial, reference steady state value). B. After an increase of V6 (γ6, 3 times). C. Decrease of the influence of gRBC on V7 (g73, 2 times). D. Increase of V5 (γ5, 80 times). E. Simultaneous decrease of the influence of gRBC on V7 (g73, 2 times) and of the influence of IS on V2 (g24, 200 times). Continuous lines represent the prediction of the model in control conditions (no intervention on the target rate processes), while red continuous lines represent the prediction of the model after the corresponding interventions.

