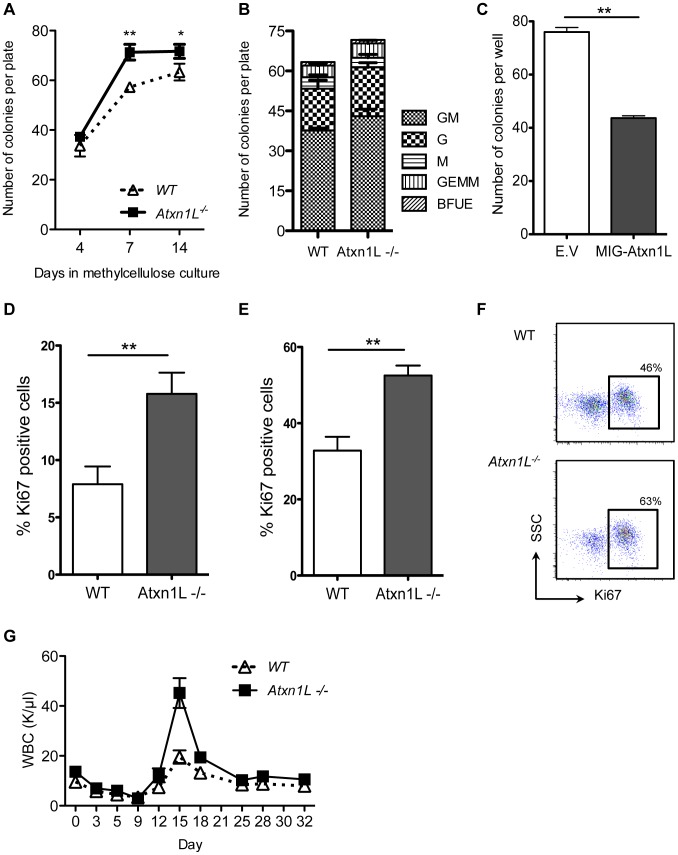
Figure 4. Loss of Atxn1L results in more proliferative hematopoietic stem and progenitor cells.
A. Individual HSCs were sorted into 96-well plates containing methylcellulose media and colonies were counted and scored based on their morphology at the indicated time points. B. Proportions of colony types. C. Colony numbers from BM cells transduced with Atxn1L-overexpressing retrovirus compared to a GFP-only control vector (E.V). Results represent the average of three 96-well plates (P<0.01). D and E. In vivo proliferation analysis of WT vs Atxn1L−/− HSCs (D) (KSL, Flk2−, CD34−) and hematopoietic progenitors (E) (KSL) by Ki67 staining (n = 5, P<0.05). F. Representative flow cytometry plots of Ki67 staining on hematopoietic progenitors (KSL). G. Complete blood counts over time of blood from WT and Atxn1L−/− mice after a single injection of 5-FU. (n = 10/genotype, P = 0.0007). The graph shows representative data from three independent experiments. All graphs display the mean plus standard error.

