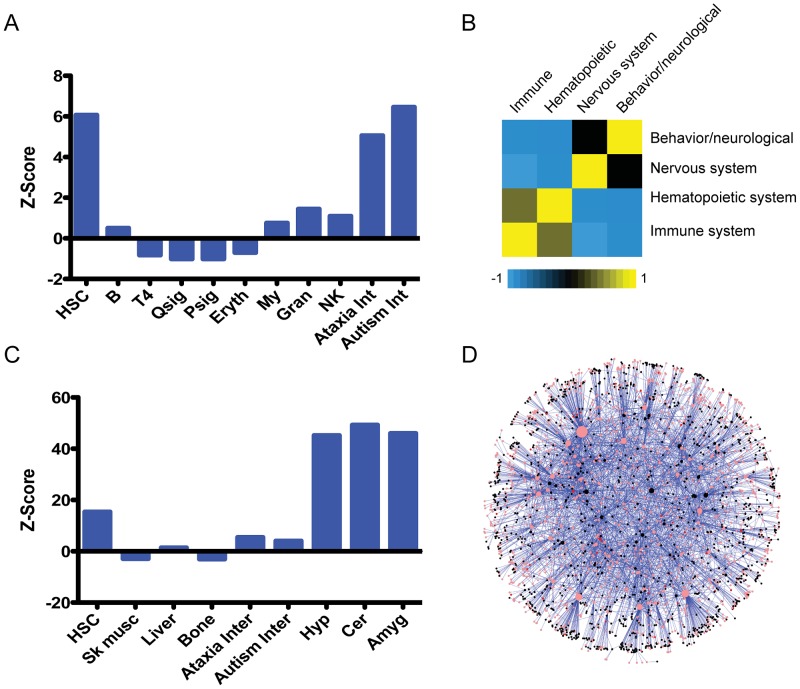
Figure 6. An unexpected relationship between the hematopoietic and nervous systems.
A. Enrichment scores (a standardized measure of deviation between the observed overlap and expected overlap of two sets: ((observed – expected)/StDev(observed)), see methods for details) for the indicated gene sets compared to genes reported to have behavioral/neurological or nervous system phenotypes in the Mouse Genome Informatics (MGI) database; Fisher's exact tests were used to determine p-values. B. Analysis of the correlation between reported phenotypes across all genes from the MGI database, with −1 (blue) representing negative correlation, and 1 (yellow) representing high correlation. C. Enrichment analysis (same as in A above) for genes expressed in HSCs compared to the indicated gene sets. D. HSC expressed genes were mapped to the ataxia interactome. This subnetwork consists of HSC expressed nodes and their connected interacting partners that form the ataxia interactome. HSC expressed proteins are pink, HSC fingerprint proteins are red and black nodes are interacting partners. The node size corresponds to its connectedness with the rest of the network.

