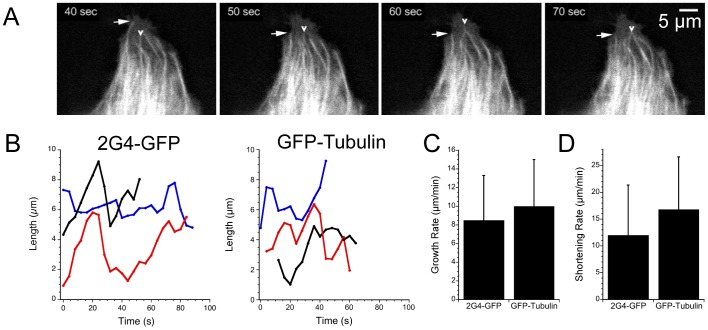
Figure 3. Microtubule length changes detected by 2G4-GFP or GFP- α-tubulin.
(A) Sequential images from the periphery of an LLCPK cell expressing 2G4-GFP. Arrows note length changes of several microtubules. Scale bar = 5 µm. The video sequence is presented in Movie S1. (B) Plots of microtubule length changes over time for three microtubules labeled by 2G4-GFP or by GFP-α-tubulin. Length changes over time were determined from image series as described in Methods (C,D). Microtubule growth (C) and shortening velocities (D) measured by 2G4-GFP or GFP-α-tubulin. Data shown are means ± sd. Additional parameters of dynamic instability are summarized in Table 1.

