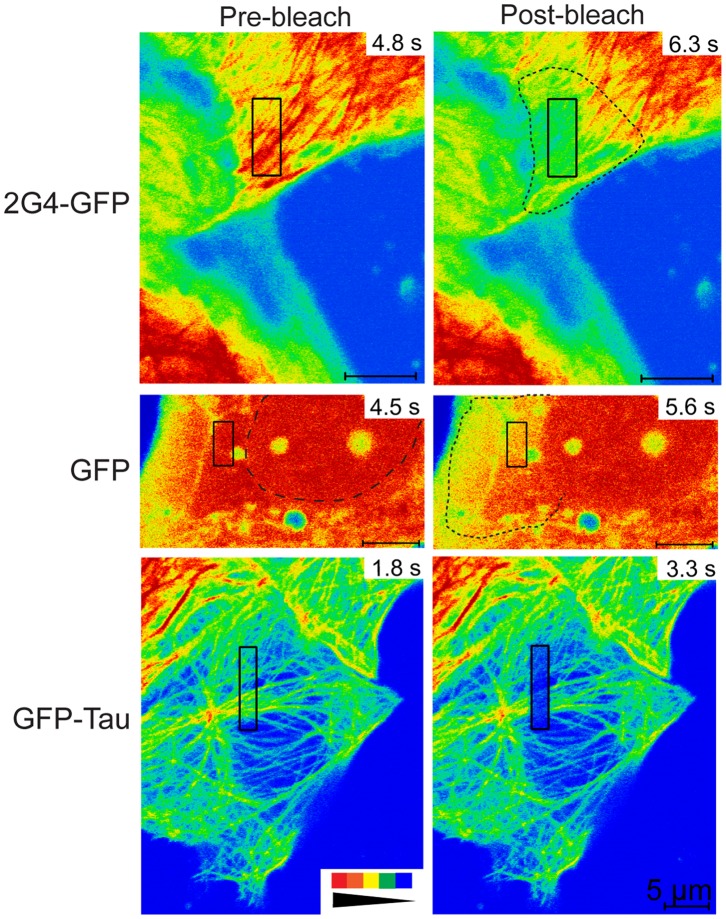
Figure 4. Photobleached 2G4-GFP spreads beyond the region targeted by the bleaching laser.
Pre-bleach and post-bleach images are shown for LLCPK cells expressing 2G4-GFP, GFP or GFP-tau as noted. Pre-bleach images were collected immediately prior to photobleaching an area marked by the black rectangular boxes. Post-bleach images were collected immediately after photobleaching. Time in each frame is given in seconds from the start of an imaging experiment. Fluorescence intensity is represented by a rainbow palette from red to blue (see inset at bottom left). For both 2G4-GFP and GFP, the region of dimmed fluorescence has spread beyond that targeted by the bleaching laser. This spread is highlighted by dotted lines in the post-bleach images. The spread of photobleached proteins is likely due to rapid diffusion in and out of the photobleached area. For the GFP pre-bleach image, the nucleus is outlined by a dashed line. Note that fluorescence within the nucleus does not appear to exchange significantly with that in the cytoplasm over the ∼2 s interval between images. In contrast to 2G4-GFP and GFP, GFP-tau photobleaching yields an area of dimmed fluorescence that closely matches the region targeted by the laser. Scale bars for all images are 5 µm.

