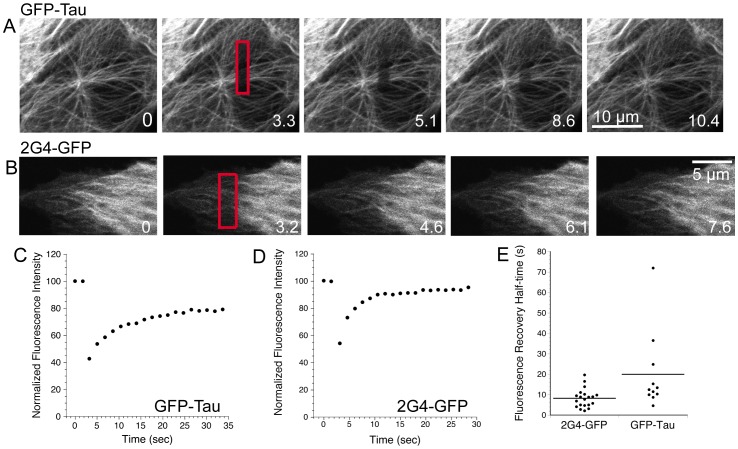
Figure 5. Rapid recovery of GFP-tau or 2G4-GFP after fluorescence photobleaching.
(A,B) Images of GFP-tau or 2G4-GFP expressing LLCKP cells before (time 0) and after photobleaching rectangular boxes (bleached regions indicated in red) are shown. Time is given in s. (C,D) Typical fluorescence recovery curves for photobleached rectangles in cells expressing GFP-tau or 2G4-GFP. Fluorescence was normalized as described in Methods. (E) Dot plot showing the half times of fluorescence recovery within boxed regions for 2G4-GFP or GFP-tau. Video sequences are available as Movie S2, S3, S4.

