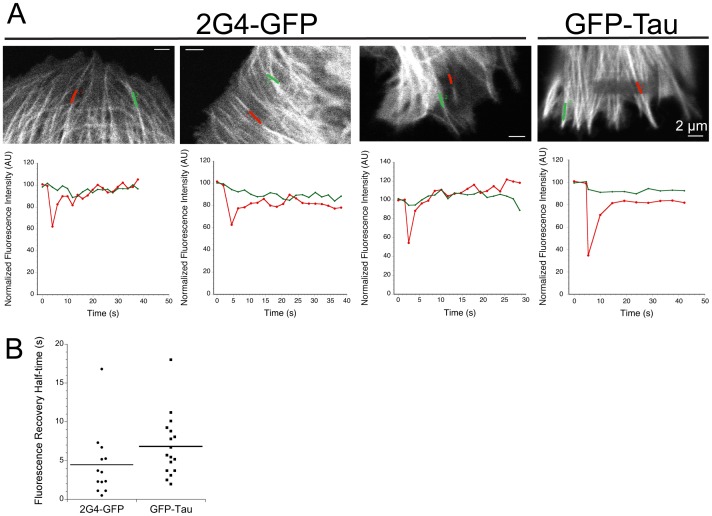
Figure 6. 2G4-GFP turns over rapidly on microtubules.
(A) Images shown were recorded immediately after photobleaching. Line scans along individual photobleached microtubules within LLCPK cells expressing either 2G4-GFP or GFP-tau are positioned as indicated. Line scan 1 (red) follows a microtubule region within the photobleached area and line scan 2 (green) follows a microtubule outside the photobleached rectangle. Normalized fluorescence recovery, integrated over each line, is shown below each example. (B) Dot plot showing fluorescence recovery half times.

