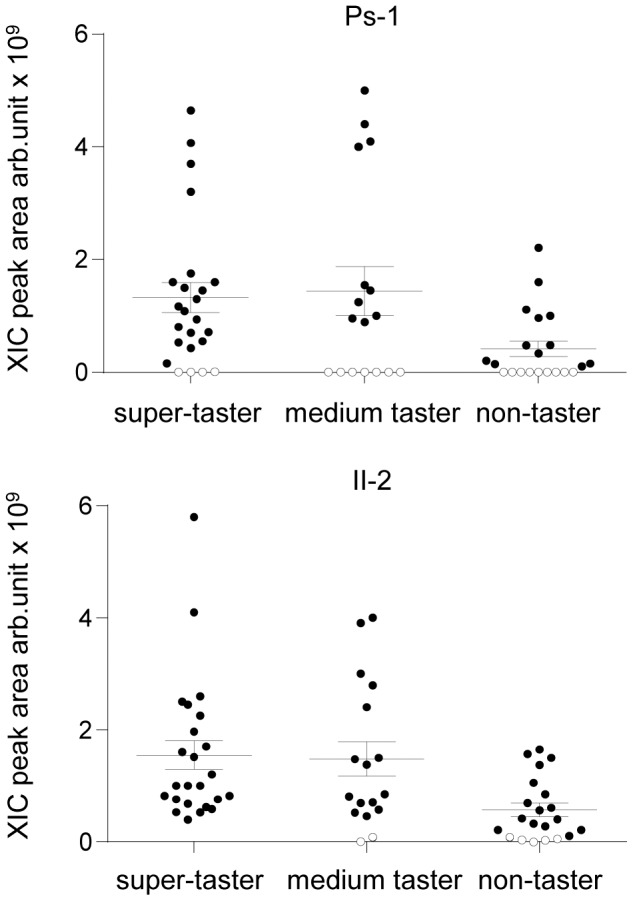
Figure 2. Relative concentrations of Ps-1 and II-2 in the PROP taster groups in unstimulated (resting) saliva.

Distribution of the XIC peak areas of Ps-1 and II-2 and mean values ± SEM for each taster group are reported. Ps-1 mean values were lower in non-tasters than in PROP super-tasters and those of II-2 were lower in non-tasters relative to the other groups (Ps-1: p = 0.0216; II-2: p≤0.004; Kruskal-Wallis test). Out of 62 subjects, n = 21 non-tasters, n = 17 medium tasters and n = 24 PROP super-tasters. Subjects lacking Ps-1 (n = 20) or II-2 (n = 7) in their saliva are identified by white circles.
