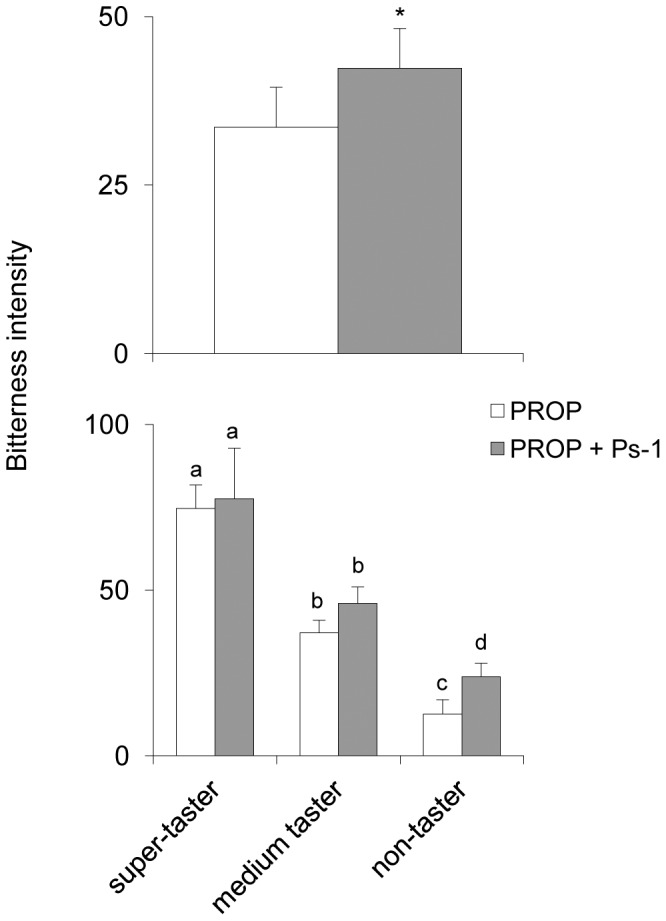
Figure 3. Effect of the Ps-1 protein on PROP bitterness intensity.

Mean (± SEM) bitterness intensity evoked by PROP and PROP+Ps-1 solutions (upper graph) in 20 subjects lacking Ps-1. The same data are shown in the lower graph for each taster group (n = 9 non-tasters; n = 7 medium tasters; n = 4 PROP super-tasters). The solution containing only Ps-1 (control) is not shown as it did not evoke any taste perception. * = significant difference (F[1,17] = 7.2273, p = 0.0155; repeated measures ANOVA). Different letters indicate significant differences (p≤0.0012; Newman-Keuls test subsequent to repeated measures ANOVA).
