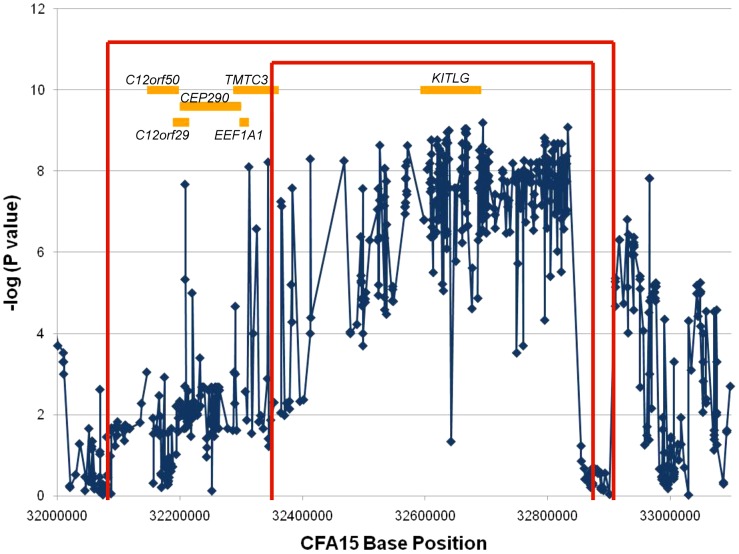
Figure 3. Recombination and association analyses resolve the region to the KITLG locus.
The association analysis results for the 658 SNPs with minor allele frequencies >10% are plotted as the negative log of the uncorrected P value. The X-axis is the base position along CFA15. The results of the recombination analysis are shown as the red brackets with the inner and outer red brackets indicating the one and three recombination intervals respectively. The orange boxes are the known or predicted genes in the region, as labeled.

