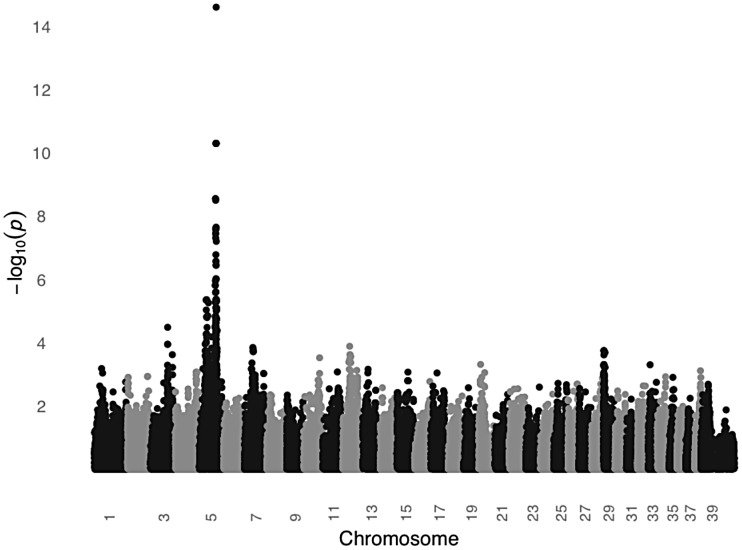
Figure 6. A significant association on CFA5 was identified in a GWAS comparing black and light colored STPOs.
The GWAS compared 24 black and 24 light colored STPOs at 126,697 SNPs. Chromosome position is listed on the X-axis, and the negative log of the uncorrected P value of association of each SNP with the phenotype, as taken from EMMAX is indicated on the Y-axis.

