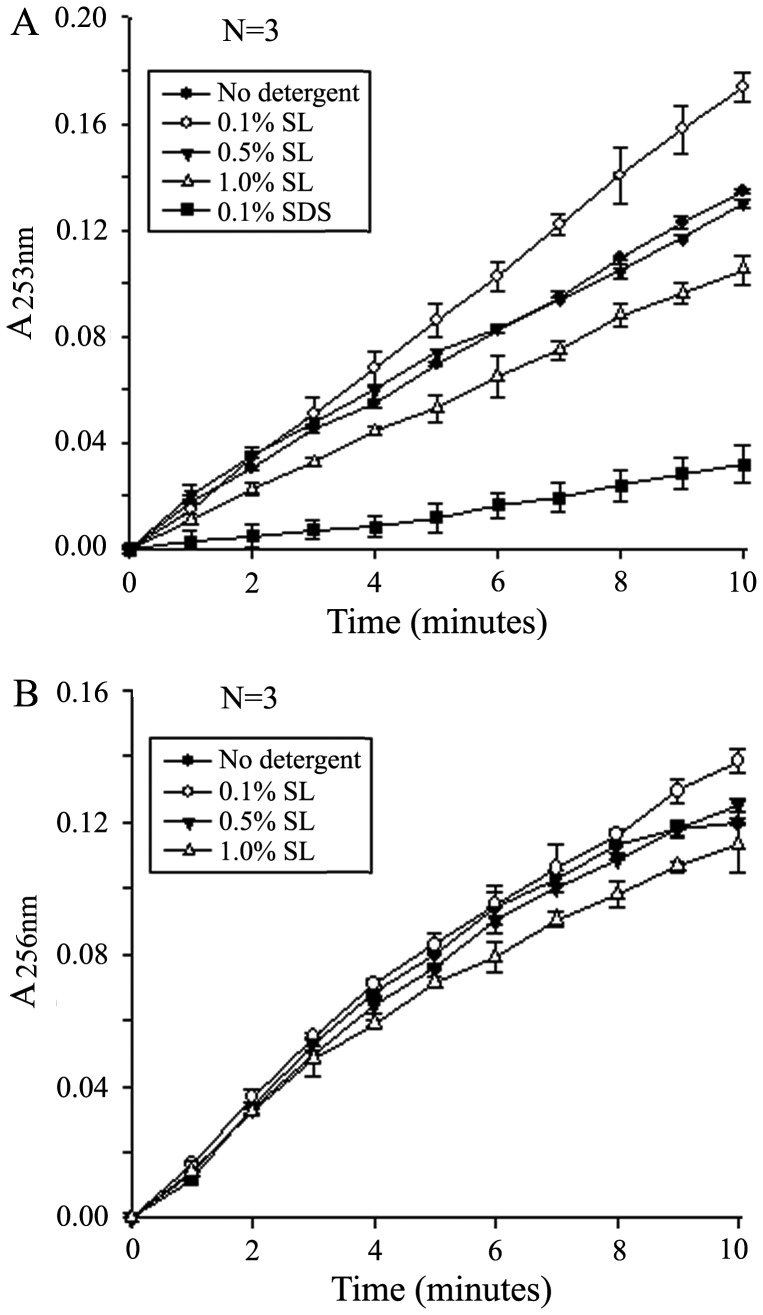
Figure 2. Enzyme activity measured in the presence of different concentrations of SL.
(A) Trypsin. BAEE was hydrolyzed by trypsin to UV-absorbing product BA. Trypsin activity was measured as a slope of the UV absorbance change at A 253 nm. (B) Chymotrypsin. BTEE was hydrolyzed by chymotrypsin to UV-absorbing product BT. Chymotrypsin activity was measured as a slope of the UV absorbance change at A 256 nm. Data were averaged from three measurements.

