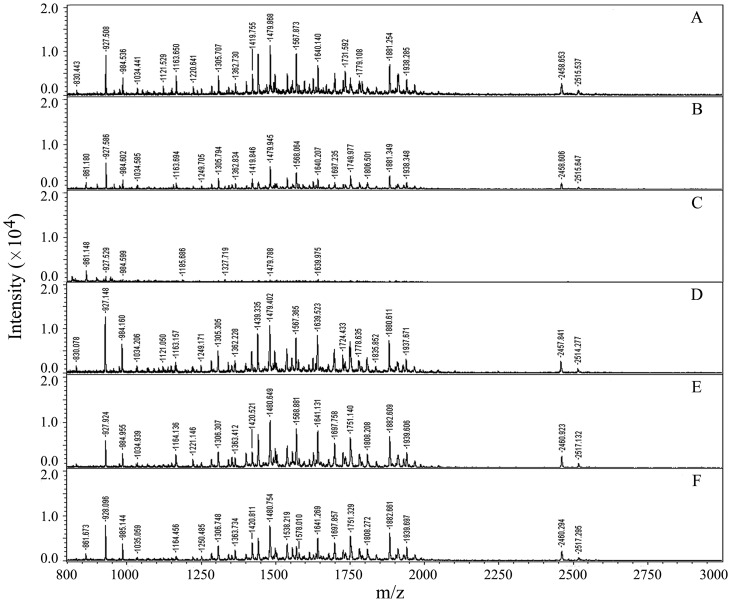
Figure 3. MALDI-TOF MS spectra of tryptic digests of BSA.
(A) mixed with matrix (1∶1) without addition of SL; (B and C) mixed with matrix (1∶1) after addition of SL (the final concentrations were 0.1% and 0.5%, respectively); (D–F) mixed with matrix (1∶1) after addition of SL (the final concentrations were 0.1%, 0.5% and 1.0%, respectively) and then removing it by acidification and phase-transfer method.

