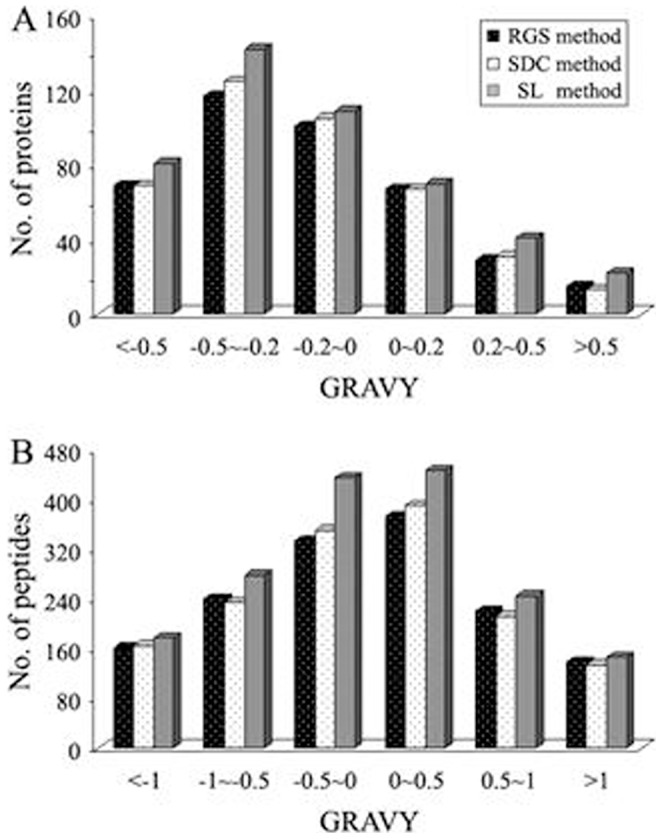
Figure 6. Comparison of the distributions of proteins and their matching peptides identified based on the three different digestion methods.

(A) Distribution of identified proteins as a function of the calculated grand average of hydropathy (GRAVY) values. (B) Distribution of identified peptides as a function of the calculated grand average of hydropathy (GRAVY) values. The data merged from triplicate analysis were used for comparison.
