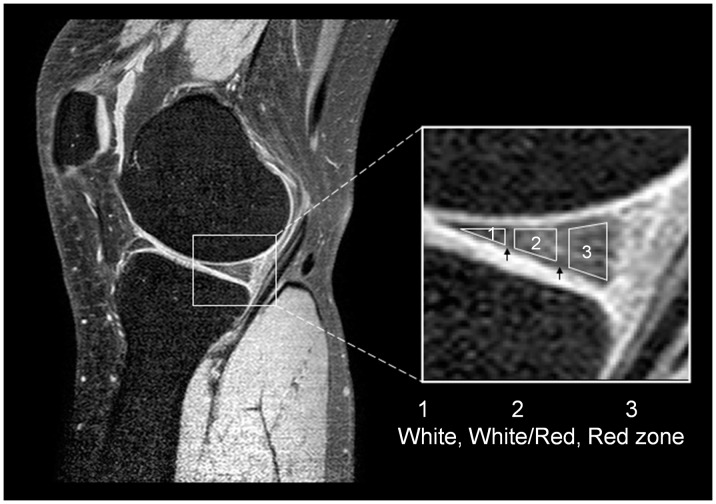
Figure 2. Representative ROIs in a nearly sagittal slice of a knee meniscus are shown.
The selection of ROIs was performed on the first-echo MR image, which is enlarged on the right side. The black arrows indicate the separation between the three zones, and each zone was about one-third the width of the meniscus.

