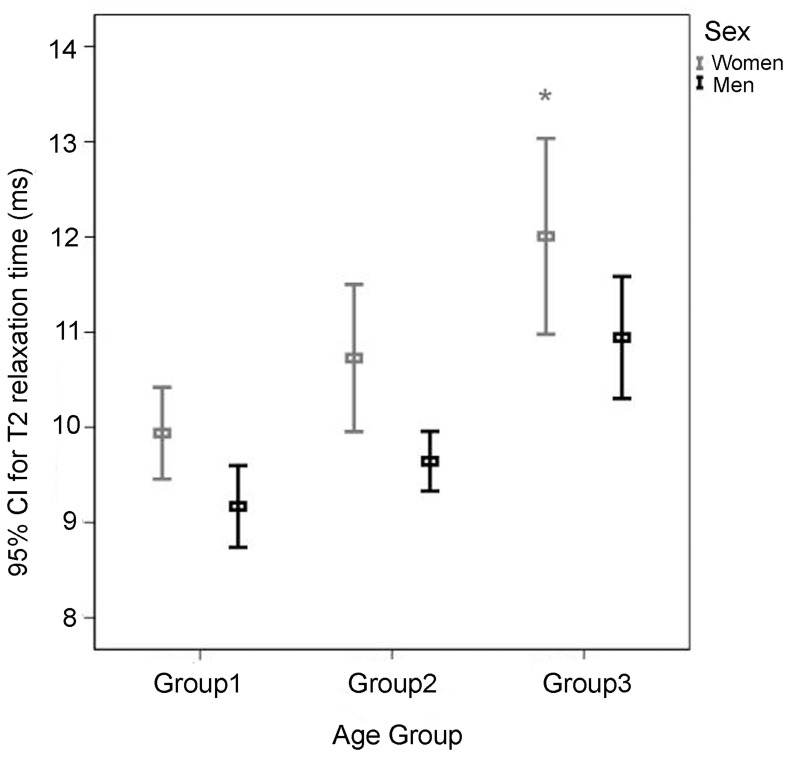
Figure 3. T2 values of both menisci for three age groups of women and men.
In women, T2 values increase significantly from group 1 to group 3 (*P<0.001 as compared with group 1). Women show significantly greater T2 values than men in all three age groups (with P = 0.001, 0.004, and 0.049, respectively).

