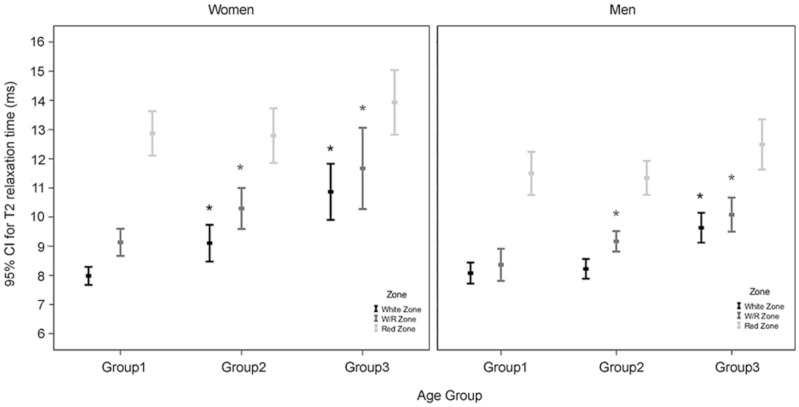
Figure 5. T2 values of the three zones in three age groups of women and men.
The differences in T2 values for the white zone and R/W zone in women and men are significantly greater between group 3 and group 1 and between group 2 and group 1 (*P<0.01) but no corresponding differences exist for the red zone in women and men.

