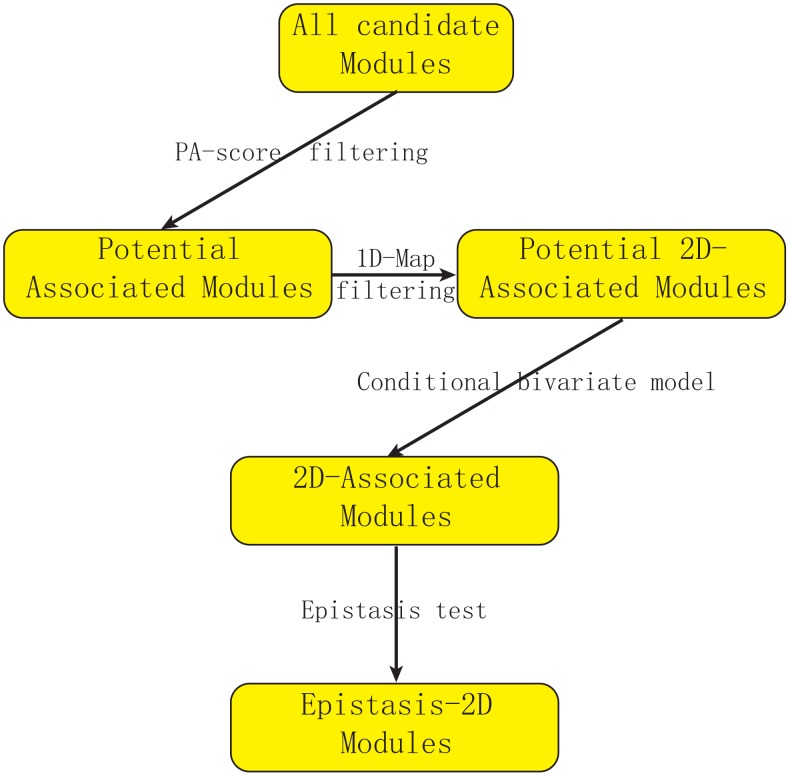
Figure 1. Flowchart of our strategy for detecting epistasis based on 2D-trait.
We first use PA-score to filter out modules unlikely to be significant. Then we filter out modules where the association can also be detected using expression levels (1D-traits). We introduce a conditional bivariate model to characterize Epistasis-2D module and use the likelihood ratio test to define p-value. Finally, we perform an epistasis test to remove modules with only marginal signals (Details in Text S1).

