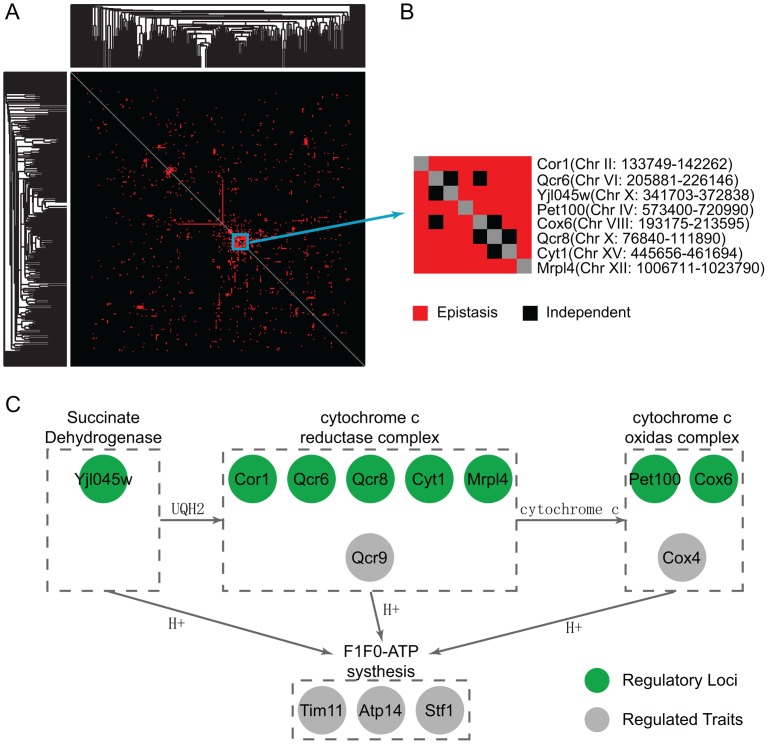
Figure 3. Clustering in the epistasis map reveals a functional genetic module in oxidative phosphorylation pathway.
(A) The clustering heatmap of the detected epistasis under the glucose condition. (B) One cluster contains eight highly interacting loci. Their co-targets in the module are mostly functional in the oxidative phosphorylation pathway. There are candidates also functional in the same pathway at these eight loci. (C) A diagram showing the regulatory pathway from the literature, where the green circle represents the candidates and the grey circle represents their targets in the modules.

